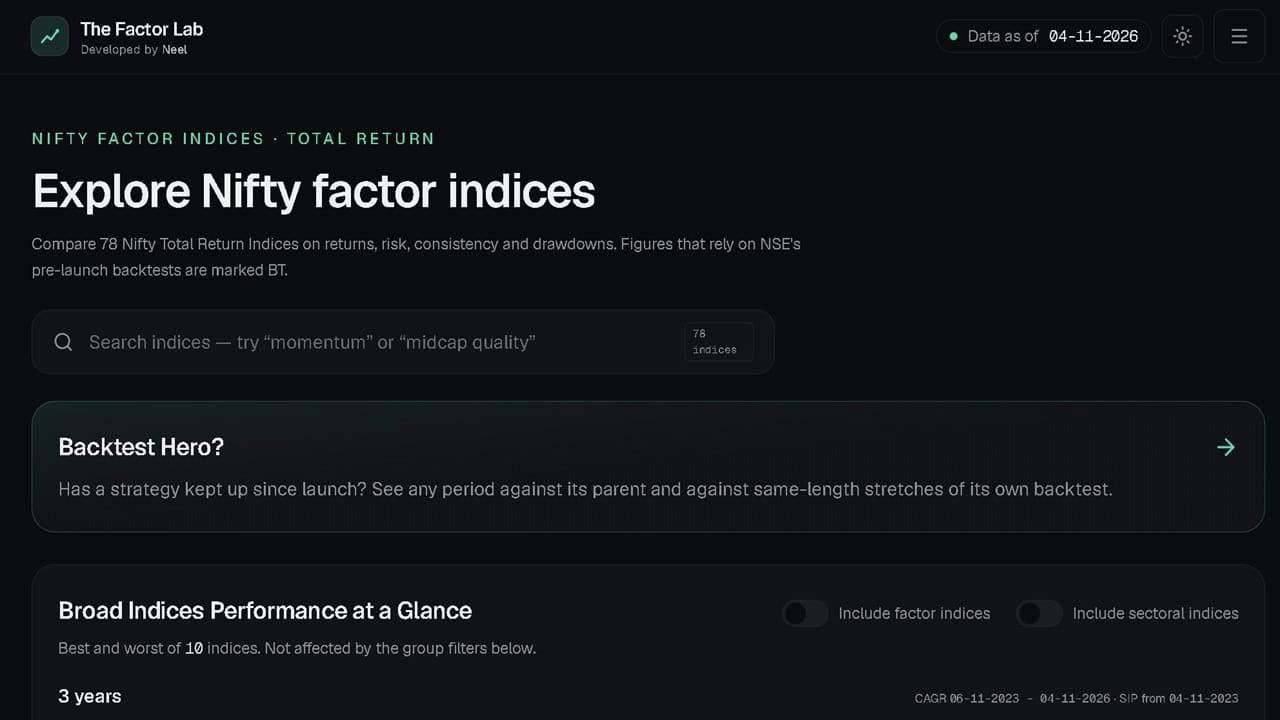
Neelmani Thakur has built a portal for researching factor indices called the Factor Lab. This is an account of his experience.
I only invest in index funds. Around 2023, I was putting money into a Nifty Midcap 150 fund, quite happily, when I came across its fancier cousin: the Nifty Midcap 150 Momentum 50. The performance numbers looked unreal. Same universe of midcap stocks, just filtered by momentum, and the long-term chart left the parent index far behind.
It wasn’t the only one catching my eye. The Nifty 500 Momentum 50 was a close contender, and the Nifty 200 Momentum 30 already had a UTI index fund with a surprisingly large AUM for something that was both passive and factor-based. Clearly I wasn’t the only one interested.
So I did what I usually do. I started reading, and I kept reading.
The tools just weren’t there
The problem was that I couldn’t test any of what I was reading. There was no proper tool or website where I could take a factor index, put it next to its parent, and look at it honestly.
🔥Secure your future with our Robo-advisory tool trusted by over 3,500 investors and advisors. From effortless retirement planning to funding your children’s biggest dreams, turn your financial goals into reality. 🔥
Subscribe for money management solutions via email! (Link takes you to our email sign-up form) Join 32,000+ readers in our community.
👉 New Tool Alert! NaviPlan: A Privacy-Focused Multi-asset Tracker and Goal Planner 👈
I’m not an engineer, software or otherwise, and I had no coding knowledge. So I tried Google Sheets. I struggled for a long time just to get rolling returns working. If you’ve read freefincal for any length of time, you know why rolling returns matter. A single point-to-point return depends heavily on which start and end dates you happen to pick. Rolling returns show you every possible holding period, so you see how often a fund did well, not just how well it did on one lucky stretch.
Most of the online discussion didn’t go anywhere near this. On Reddit, people would quote something like 60x returns for Midcap 150 Momentum 50 against 15x or so for its parent, and treat that as settled. What they missed is that most of that history is a backtest. The index didn’t exist for most of those years. Someone designed the rules with the full benefit of hindsight, and a rule designed on past data will almost always look great on that same past data. That’s curve fitting, and it’s the reason a backtest is a hypothesis, not a track record.
I’ll admit I had a strong urge to move my new investments into Midcap 150 Momentum 50. I held off.
What happened after launch
A few years on, I’m glad I waited. Most factor indices are in poor shape right now, and the gap between their backtests and their live performance is hard to ignore.
Momentum. The usual defence is that momentum does badly when markets fall and will come back. That may well be true. But look at the Nifty 200 Momentum 30. It did do well for the first year or two after launch. Today it is underperforming the Nifty 200 over all the shorter time frames and only barely keeping pace over the longer ones, with much higher volatility along the way. More risk for roughly the same return is not what anyone signed up for.
Quality. If momentum’s struggles can be blamed on a falling market, quality has no such excuse. The Nifty Midcap 150 Quality 50 is probably one of the clearest examples of an index doing badly against its parent, and doing so right after launch.
Low volatility. These are the only ones that seem to hold on to their main selling point after launch. They really are less volatile. But they don’t beat the Nifty 500 by the five-odd percentage points a year their backtests suggested.
None of this means factor investing is useless, and things can change. It does mean that the backtest number on the factsheet is a poor guide to what you’ll actually get.
Building a tool by accident
I never set out to build anything. I was asking Claude, Anthropic’s AI assistant, the same questions I’d been asking myself, and at some point it offered to run the tests for me. I gave it the data by hand, it did the calculations, and I kept asking follow-ups. It kept answering.
After a while I asked whether we could build something visual, so I didn’t have to keep typing questions into a chat. That led, one step at a time, to a small app running locally in my browser, built with Python, DuckDB and Streamlit. (I had to look up what those were.)
The next step was to stop feeding it data by hand. We automated the download directly from NSE. The first fetch took about 30 minutes. After that it only needed the latest days, since everything older was already saved. From there I added features one by one, as and when I wanted them.
What The Factor Lab does, among other things
Rankings. This one started as a manual habit. I would look up where each index ranked over different periods, note the ranks down, and average them to see which one came out on top most consistently. It was tedious. The dashboard now does it visually, without the manual labour, and you can change the periods and the indices you compare.
Comparisons over any time frame. Pick any start and end date, any set of indices, and see them side by side. Not just the standard 1, 3 and 5 years that every factsheet shows, but whatever window you want to test, along with rolling returns over it.
Risk-adjusted numbers. Returns alone don’t tell you much if one index got there with twice the swings. So alongside returns you get volatility, maximum drawdown and the usual risk-adjusted ratios: Sharpe, Sortino, Calmar and others. This is where a lot of the shine comes off factor indices that look great on returns alone.
The BT label. Whenever a number includes even part of a backtested period, a small BT label shows up next to it. It sounds minor, but it’s the thing I most wished I’d had in 2023. You always know whether you’re looking at real, live performance or at a hypothetical history designed after the fact.
Backtest Hero. This is the part I’m proudest of, and the name is the question it asks: is your super-duper strategy index a real performer, or only a backtest hero?
It lets you compare a factor index against its parent for the period after launch, or any other period you choose. More importantly, it lets you compare an index against itself: the backtested years next to the live years. Seen side by side, the difference between backtest and reality is very clear. I’d rather show you than describe it, so please try it at thefactorlab.in.
From my laptop to a website
The local version had one big limitation. It only worked on my PC, with the data files sitting on it. I wanted to check things from anywhere, including my phone.
So I asked Claude again, and again it went step by step until we ended up with the website you can see today. Same story as before: I didn’t plan a website. It grew out of asking and implementing, one piece at a time. The data now updates from NSE automatically every evening, and the site works on whatever screen you open it on, phone, tablet or desktop.
What building with AI actually takes
A few honest observations for anyone tempted to try something similar.
In my experience, Claude Code is currently well ahead of ChatGPT for this kind of work. The Pro plan, around ₹2,000 a month, can do things I never thought possible for someone like me.
You don’t need to know how to code. You do need a logical mind. I didn’t write a single line of code, but I wrote a lot of paragraphs. Some of my messages took 20 to 30 minutes to type on my phone, spelling out exactly what I wanted, where I wanted it, and how it should behave. Then I tested the result, found what was wrong, and explained it again.
The way AI is moving, maybe in six months you’ll be able to build a whole website from one sentence. Right now, you still have to be curious, stay involved, and be willing to apply your mind. These tools can do remarkable things, but only if you keep asking and keep pushing to find their limits.
Where I stand as an investor
I was one of those people who got into the nitty-gritty of personal finance while still in college. I knew the AIFW basics before I had earned a single rupee, and I was weighing index funds against active funds when my first salary was still years away. A lot of that reading happened right here on freefincal.
So when I finally started investing, I already knew what I wanted to do. I chose index funds: a Nifty LargeMidcap 250 fund, an S&P 500 fund, and later a Midcap 150 fund.
I don’t add things just for a taste of it, as Pattu likes to put it. I don’t hold a token 10% in international funds because they were once in fashion, or because people are chasing them now (good luck finding one that’s open). I put 40 to 50% into the S&P 500 from the very start.
That’s working out well at the moment. But until around mid-September 2024, my LargeMidcap 250 fund was the star, beating the S&P 500 by a good margin. I know very well that the tide can turn at any time, in either direction. I’m prepared to stick with roughly 50:50 between the US and India, and that’s really the same lesson as the factor indices: pick something sensible, understand why, and don’t chase whatever looked best recently.
Try it yourself
The Factor Lab is free to use at thefactorlab.in. Pick a factor index you’ve been eyeing, open Backtest Hero, and compare its live years with its backtest. Then compare it with its parent over rolling periods. You may be surprised.
Nothing on the site is a recommendation. It’s a tool for checking claims, including your own. If you spot an error or have an idea for a feature, I’d love to hear from you.