
Last Updated on December 10, 2022 at 9:45 pm
We are happy to release a new market timing tool with which you can convert daily price data to monthly data and compute moving averages for equity (indices, stocks and mutual funds), gold and gilt (using bond yield). This is a follow up to backtest conducted on equity, gold and gilts using double and single moving averages.
This is a momentum-based trend-following tool in Excel (will work in the old Excel version as it is a .xls file but macros are necessary for daily to monthly price conversion).
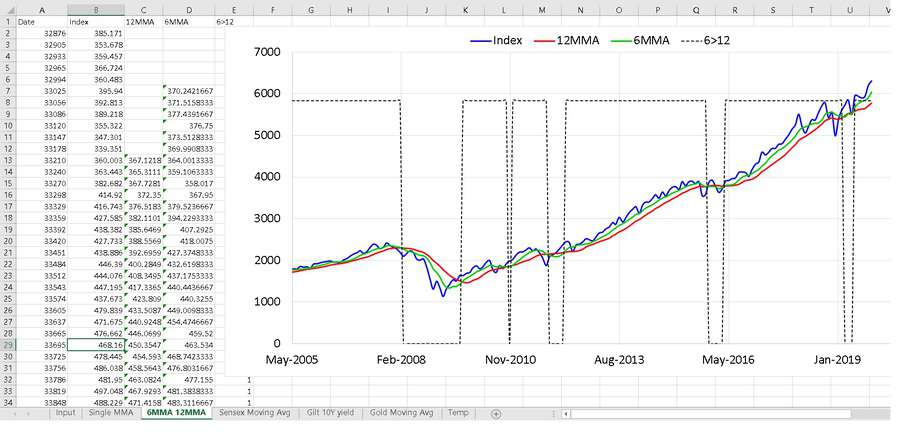
For instance, if the six-month moving average (6MMA) is greater than the twelve-month moving average (12MMA), it is a “buy” signal for equity or gold. If 6MMA < 12MMA it is a “sell” signal”. This is a high-risk strategy with potentially higher rewards. Please read the warning and disclaimer section fully and carefully.
Warning and disclaimer
Start of warning and disclaimer: The strategy outlined in the above articles and in this tool may or may not provide a higher return when you try it. Our backtests reveal that this strategy has a higher risk than systematic investing. It may not always provide a higher reward for the higher risk taken. So users must appreciate this before considering this strategy.
Please recognise results shown in backtests do not factor in future market movements, human emotions, taxation and exit loads. All these would impact the outcome of market timing (aka tactical asset allocation wrt this tool).
Not all asset allocation variations and investment durations were considered in our backtests. Past results and future results will depend on and vary according to the asset allocation mix used and investment duration considered. For example, for equity, the model works reasonably well with 50% equity or lower equity (rest in fixed income) and not so well for higher equity allocations.
Our backtests indicate that the model fails for sharp price changes (up or down, eg. the March 2020 market crash) and the following sequence of returns.
No single strategy would work for all markets and at all times. After extensive backtesting, we have arrived at this strategy as a reasonable choice at the time of original publication. There is no guarantee that it would work in future. Future backtesting may reveal flaws in this strategy or reveal new or modified strategies. We reserve the right to incorporate such findings or modifications on this page, in this tool or anywhere else on our site.
Anyone who uses this tool does so at their own risk. Freefincal or this author/editor is not responsible or liable for any gains or losses that may result from the use of this tool. While the sheet has been checked for errors and bugs, like any other tool, we cannot guarantee they are free of them.
The tool is open-source (but not free). This means all the formulae and Excel VBA are accessible to the user. So users are requested to understand what the tool does and double-check for errors and inconsistencies.
The tool has a built-in “buy/sell signal”. This has different meanings for a single moving average, double moving average, gold and gilts. The users must read the above-linked articles and develop their own tactical strategy.
I will not provide any other investment advice wrt to future market movements.
Buy the sheet only if you are willing to learn, explore, investigate and devise your own, independent strategy. Please note: tactical asset allocation or market timing means exiting one asset class and entering another.
That is, as an example, if you have Rs. 100 invested into equity and the 6MMA falls below the 12MMA, you sell the equity holding (fully or partially as per your set plan) and put it into another asset class.
If you plan to use this tool only to find out “what is a good time to buy additional units or stocks”, then as discussed before the benefits of such an act is likely to either small, limited or non-existent. So kindly be aware of these limitations.
Please note that by the release of this tool, freefincal or this author is only offering tactical portfolio management as an alternative to systematic portfolio management. No claim is made about the superiority of either method. It is up to the buyer to decide on their own which is suitable for their personal circumstances.
This tool is not a financial planning tool. It will not help with goal-based portfolio management in any way. End of warning and disclaimer.
Proof of concept: backtest results
Here are the six months and twelve-month moving average results shown for equity (Sensex, small cap funds), gold and gilts. I strongly recommend that you read these articles first before using this tool. Please note that future results may vary quite significantly from past/backtest results.
(1) Is this a good time to buy gold? A tactical buying strategy for gold (2) This “buy high, sell low” market timing strategy surprisingly works! (3) Do not use SIPs for Small Cap Mutual Funds: Try this instead! (4) Can we get better returns by timing entry & exit from gilt mutual funds?
Features of the moving average market timer
This is the offer page for the course on goal-based portfolio management.
NSE Indices, MF NAV and Stock price
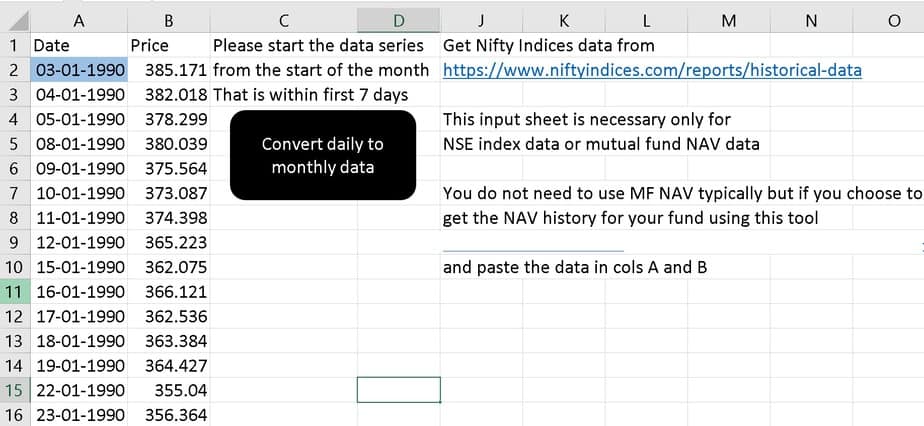
Daily data from NSE (for indices), Mutual Fund NAV (link to tool provided) or stocks (link to tool provided) can be taken and pasted in col A and B. Then on clicking the black button the monthly averages are computed..
You can calculate any monthly moving average in this sheet and generate a corresponding buy/sell signal.
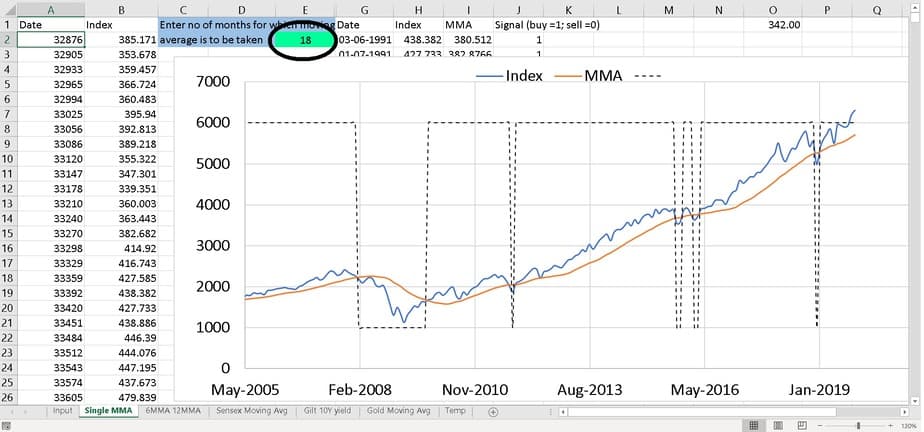
In this sheet 6 and 12-month moving averages are computed with buy/sell signal.
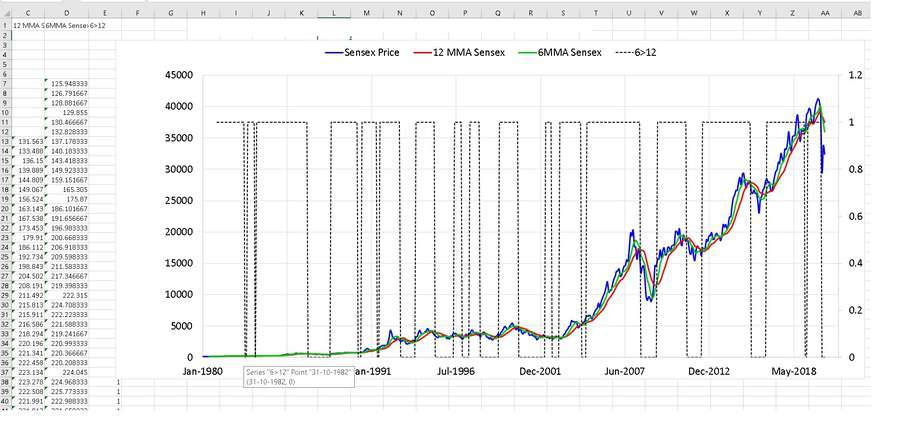
Sensex
You can get month-end Sensex data with the link provided to generate 6,12 MMAs and buy/sell signals.
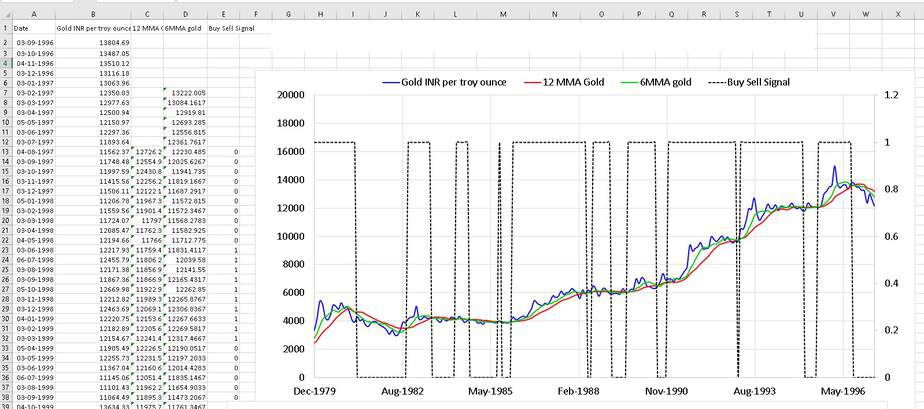
Gold
You can get month-end Gold data with the link provided to generate 6,12 MMAs and buy/sell signals.
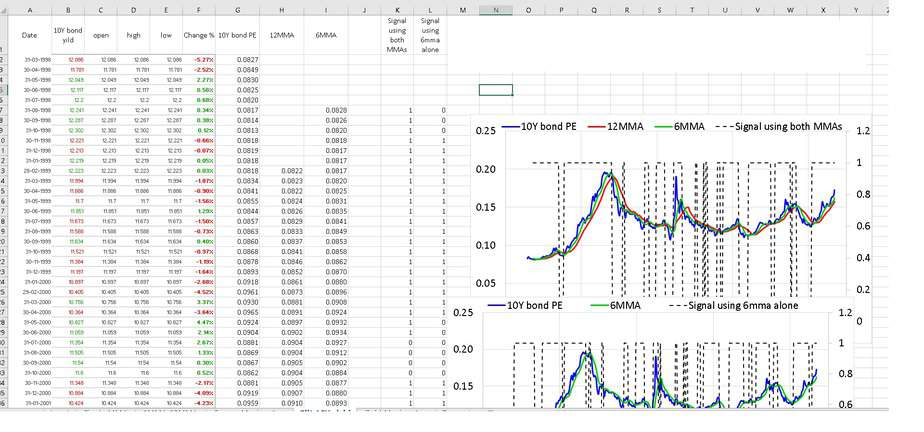
Gilt Yield
You can get month-end 10-year gilt data, calculate bond PE and then generate 6,12 MMAs and buy/sell signals. The tool tells you when the 10Y bond PE is below both MMAs. You can easily change this signal to anything that you wish. Please also see Can we get better returns by timing entry & exit from gilt mutual funds?
Demo Video
Purchase link to procure the tool
Get the Tactical buying and selling tool using moving averages (Stocks, Gold, and Gilts). Rs. 500.
You can also get Nifty PE Tool + Tactical Buy/Sell Tool as a combo deal for Rs. 1500.