Last Updated on May 17, 2022 at 3:15 pm
Gilt mutual funds can be tricky to understand. Those who assume they have invested in “safe” govt bonds would be shocked to see how much their prices (NAV) fluctuates daily and can even lead to negative or low returns over a few years. In this article, we find out if a market timing method can be applied to gilt mutual funds for better returns and/or lower risk.
Readers may recall we had employed a double moving average strategy to backtest timing gold purchases – Is this a good time to buy gold? A tactical buying strategy for gold – and timing equity purchases – This “buy high, sell low” market timing strategy surprisingly works! We find out how this can be extended to gilts.
Readers unfamiliar with gilt funds may please consult (1) Gilt mutual funds will not protect your money! Recognize risks before investing! (2) Can we buy gilt mutual funds now? They have given more than 10% returns in the last year! (3) Can we invest via SIP in gilt mutual funds for the long term?
It must be kept in mind that long-term SIPs in gilt funds (see article 3 above) have been quite productive in the past and should at the very least provide an FD-like return before tax (better than FD after tax for those in 20% and above slabs).
🔥Secure your future with our Robo-advisory tool trusted by over 3,500 investors and advisors. From effortless retirement planning to funding your children’s biggest dreams, turn your financial goals into reality. 🔥
Subscribe for money management solutions via email! (Link takes you to our email sign-up form) Join 32,000+ readers in our community.
👉 New Tool Alert! NaviPlan: A Privacy-Focused Multi-asset Tracker and Goal Planner 👈
Therefore a simple systematic rebalancing with equity is all that is necessary for most retail investors. However, we still need to satisfy our curiosity if timing would work with gilt mutual funds.
We shall compare a systematic investment in gilt funds, represented by the I-BEX composite gilt index and gilt fund + cash portfolio. The cash portfolio would earn a steady return of 0.5% a month (about 6% a year).
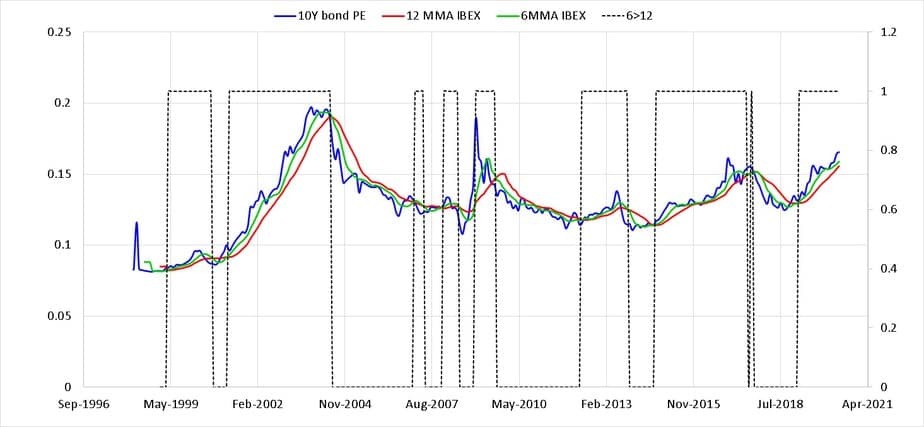
Shown below are the I-BEX and its six and twelve-month moving averages (6MMA and 12MMA). The dotted line (6>12) is the buy/sell signal as used in the previous gold and equity backrests. When the 6-month average is greater than then 12-month average the buy signal = 1 and 0 otherwise

When the buy signal =1, we sell cash and move to gilts. Further SIPs are also into gilt. When the buy signal = 0, we sell gilts and move to cash. Further SIPs are also into cash.
However, notice that the buy/sell signal =1 for most of the IBEX’s history. Therefore the NAV of a gilt mutual fund cannot be used for timing. Instead, we shall use the 10-year gilt yield.
Since yield and price are inversely proportional to each other, we work with the inverse of the 10Y bond yield. This would serve as a bond PE ratio. Recall that the inverse of the Nifty PE is known as the earnings yield. See: Has the market recovered already? Did it even crash?
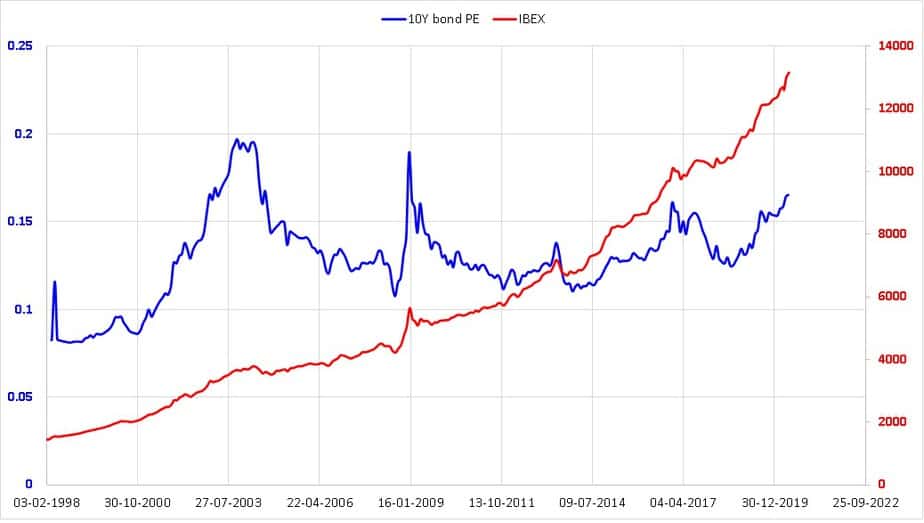
Notice that the 10Y bond PE is significantly more sensitive than the IBEX price. So we shall use this for our gilt timing backseat. Now the buy/sell signal = 1 when the 6MMA of the bond PE > 12MMA and buy/sell signal = 0 when the 6MMA of the bond PE < 12MMA
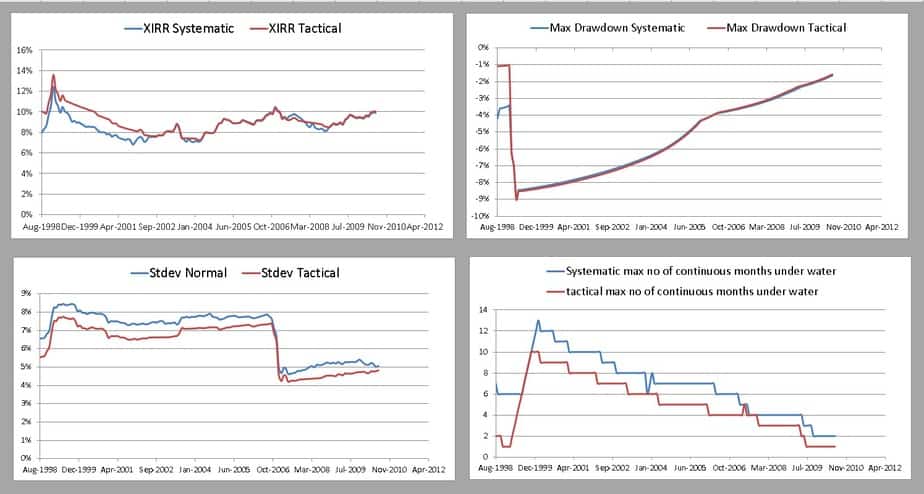
The backtest result for 10 years is shown below. Top left panel: the XIRR for each of the 138 10-year backrests are shown (higher the better!). The tactical approach has rarely beat the systematic approach (not taxes and exit loads are not accounted for)
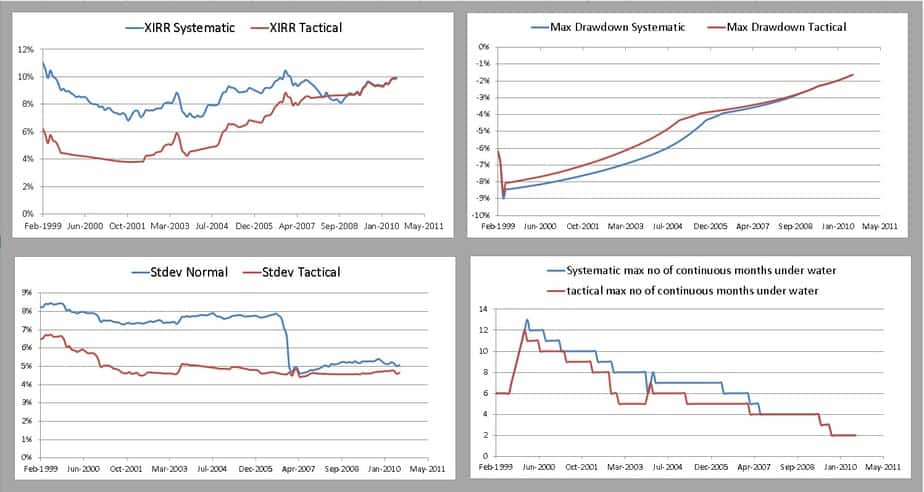
Top right panel: The maximum drawdown (max fall from peak) of the portfolio is shown (less negative the better). For some runs, the tactical approach has a lesser drawdown. Bottom left panel: The standard deviation or volatility (lower the better). The tactical approach has lower volatility. Bottom right panel: the max no of months the portfolio was below its peak or underwater (lower the better). The tactical approach does marginally better.
Results over 15-years show a similar trend. Returns are less than the systematic approach but the risk is noticeably and more consistently lower.
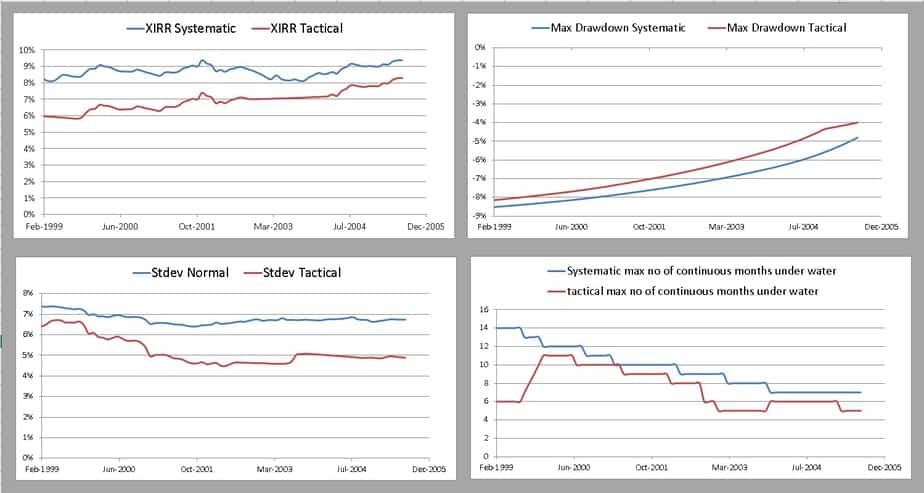
An alternative timing approach was also tried. Buy gilts when bond PE is greater than both 6MMA and 12MMA. Sell gilts when bond PE is less than both MMAs.
Results for 10 years is shown below. The tactical approach now beats the systematic approach for some runs and more importantly does not underperform. Although the max drawdowns are the same, the volatility is lower and the no of continuous months underwater is lower.
Over 15-years the tactical XIRR is better, but the volatility and max drawdowns are similar to the systematic approach.
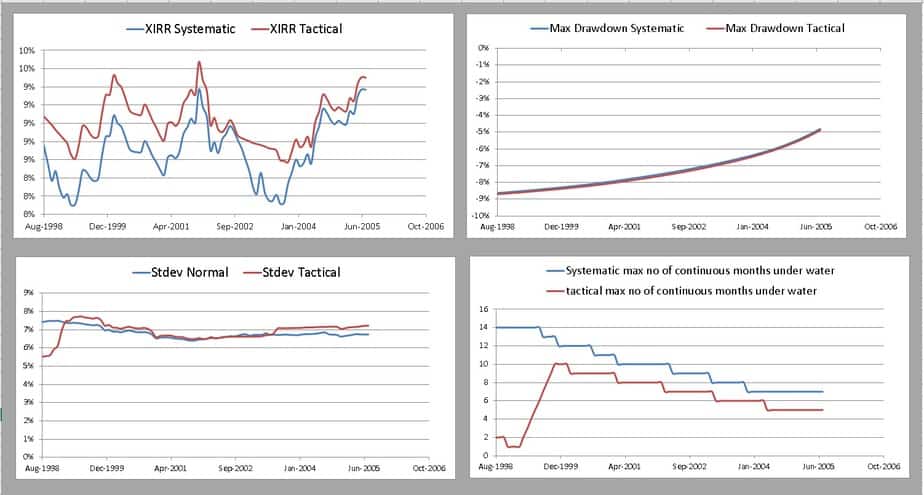
Similar studies were with only the six months moving average of the 10Y gilt PE. This is the15-year rolling backtest data. That is, buy gilts when current PE > 6MMA and sell if less.

This result is for timing with a three-month moving average and 15Y investment duration. That is, buy gilts when current PE > 3MMA and sell if less.
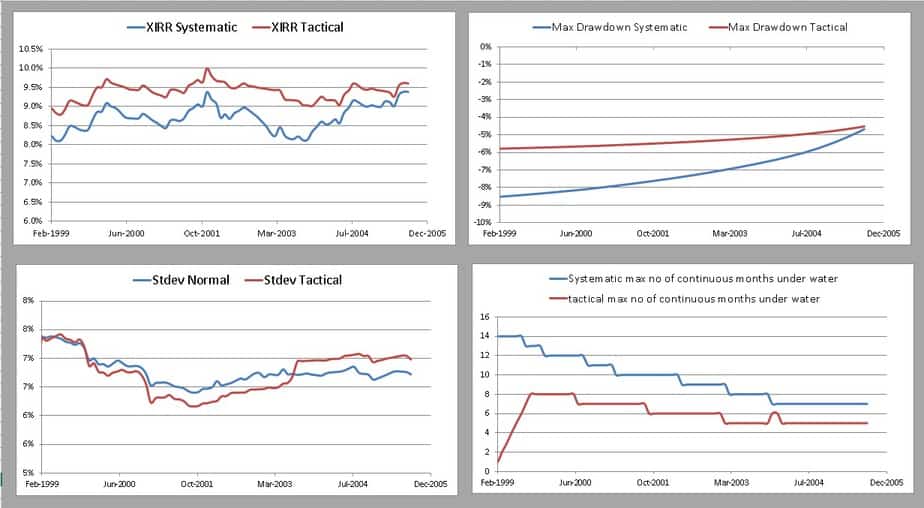
Clearly shorter duration moving averages have done much better in terms of returns and risk compared to the systematic approach. This is because of the sharp movements in the bond yield.
However, no of buy/sell transactions will sharply increase with shorter moving averages. For examples for six MMA the typical no of buy/sell transactions over a 15Y period is only 16. This is pretty much the same as systematic (annual) rebalancing. If we use three MMMA then the no transactions increase to 30-32. Considering tax and loads this becomes a little too much.
Thus it is important to strike a balance between returns, risk and tax and the 6MMA strategy or even the combination of 6,12 MMA fare reasonably well. The next step in this series is to combine all four asset classes – equity, gilts, gold and cash and time them together.
Update: A tool for tactical buying based on the above strategyis now available.