Last Updated on August 22, 2022 at 11:17 pm
When we look at “long term” gold charts, it is quite easy to assume, “gold always tend to given good returns” without realising how volatile it can be. There are ways to reduce the risk associated with buying gold and perhaps even get more returns if we are lucky. In this article, we discuss a method based on moving averages and present rolling backtest results.
We shall compare a systematic approach which is a simple SIP in gold versus a tactical approach which involves moving between gold and cash over ten year periods.
Shown below is the gold price in INR (source: World Gold Council) and the six and twelve-month moving averages. When the six-month moving average (6MMA) is greater than the 12-month moving average (12MMA), we buy gold, sell all cash and buy gold.
🔥Secure your future with our Robo-advisory tool trusted by over 3,500 investors and advisors. From effortless retirement planning to funding your children’s biggest dreams, turn your financial goals into reality. 🔥
Subscribe for money management solutions via email! (Link takes you to our email sign-up form) Join 32,000+ readers in our community.
👉 New Tool Alert! NaviPlan: A Privacy-Focused Multi-asset Tracker and Goal Planner 👈
When the six-month moving average (6MMA) is less than the 12-month moving average (12MMA), we sell gold put it in cash (6-7% return assumed) and further invest only in cash.
As an example, suppose we have Rs. 10,000 in gold and Rs. 10,000 in cash to begin with and can also invest Rs. 1000 a month. If 6MMA > 12MMMA then: We sell the Rs. 10,000 in cash and buy gold. We invest the Rs. 1000 also in gold.
If 6MMA < 12MMMA then: We sell the Rs. 10,000 in gold and store as cash. We invest the Rs. 1000 also in cash.
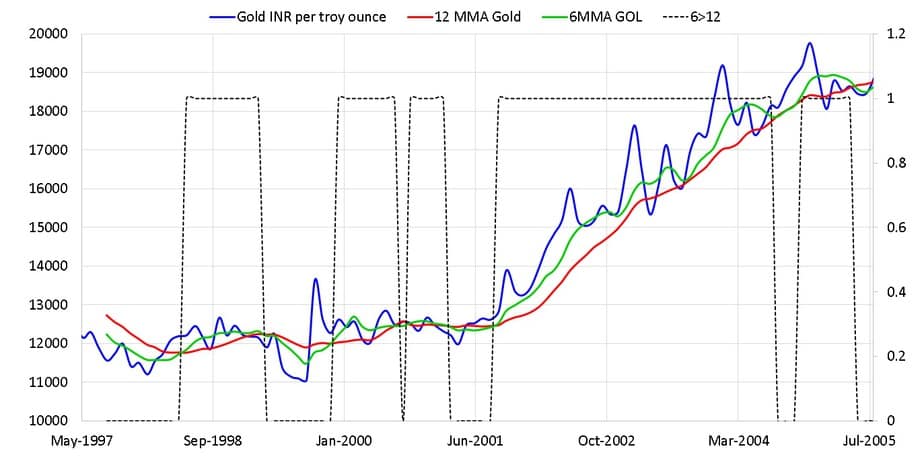
This may seem counterintuitive because we buying high and selling when it starts falling. This is a form of momentum buying. Even before we test it, we could tell from past experience: Tactical asset allocation archives that it will not work all the time.
When the 6MMA moves well above 12 MMA, stays above for a while and then heads down and stays down for a while, tactical buying might fetch higher returns. If there is no clear trend and the price keeps moving sideways then a tactical strategy may not fetch more returns.
First, let us look at results from Aug 1997 to May 2020. There are 155 10-year windows here. The four main results are shown below. Top left: XIRR: Notice that that tactical strategy has given a better return from the early 2000s onward. Tactical debt-equity results are just the opposite!
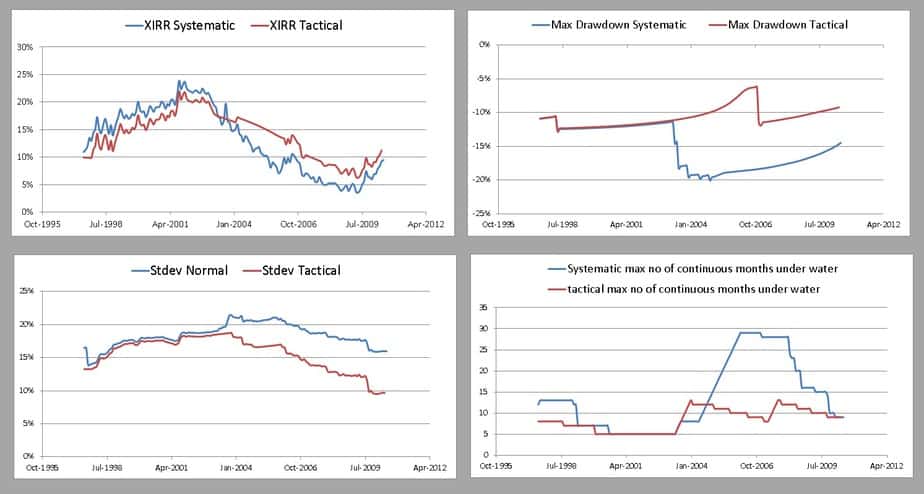
Top right Max fall from a peak (drawdown): Again from the early 2000s, the tactical strategy has enjoyed much lower falls because of the tactical exit. Bottom left volatility: The tactical strategy has generally been less volatile. Bottom right: The max months the portfolio has continuously been lower than a peak is less for the tactical strategy.
We can extend the backtest to Jan 1979. This gives us 367 10-year backtests.

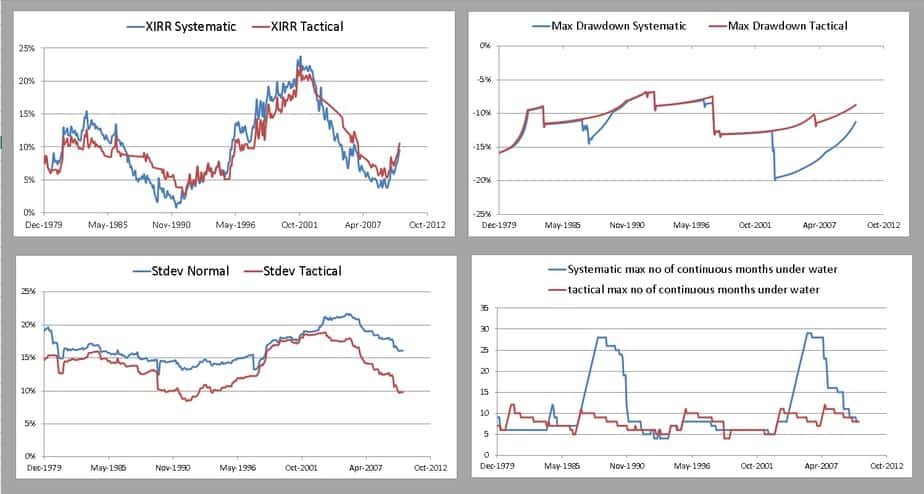
Again the tactical strategy reduces risk pretty much every time while higher returns would need a clear trend at some time in the investment journey. We have not included taxes in this study and that would reduce the no of runs with higher returns.
This is gold vs “buying gold tactically ” study. We have not included equity into this. That would be the next step. Again the message is the same. Those who can tactically asset allocation in a disciplined manner without worrying about tax are likely to lower portfolio risk. Returns might be a nice perk if lucky.