At freefincal, we have often used the Sensex price returns to portray risk via rolling lump sum and SIP returns. We have added 2% to the price return to account for dividends. This is because the price data starts from 1970 while the total returns data (that assumes dividends are reinvested without tax begins only from 1996.
This severely limits the illustration of return spreads, their cyclic nature and the inherent risk. So the price return + 2% seemed like a good idea. However, this was an arbitrary addition. How accurate is this? Is this too much or too less?
We take Sensex TRI and Price data from Aug 1996 and compute the 10-year and 15-year return differences to find out.
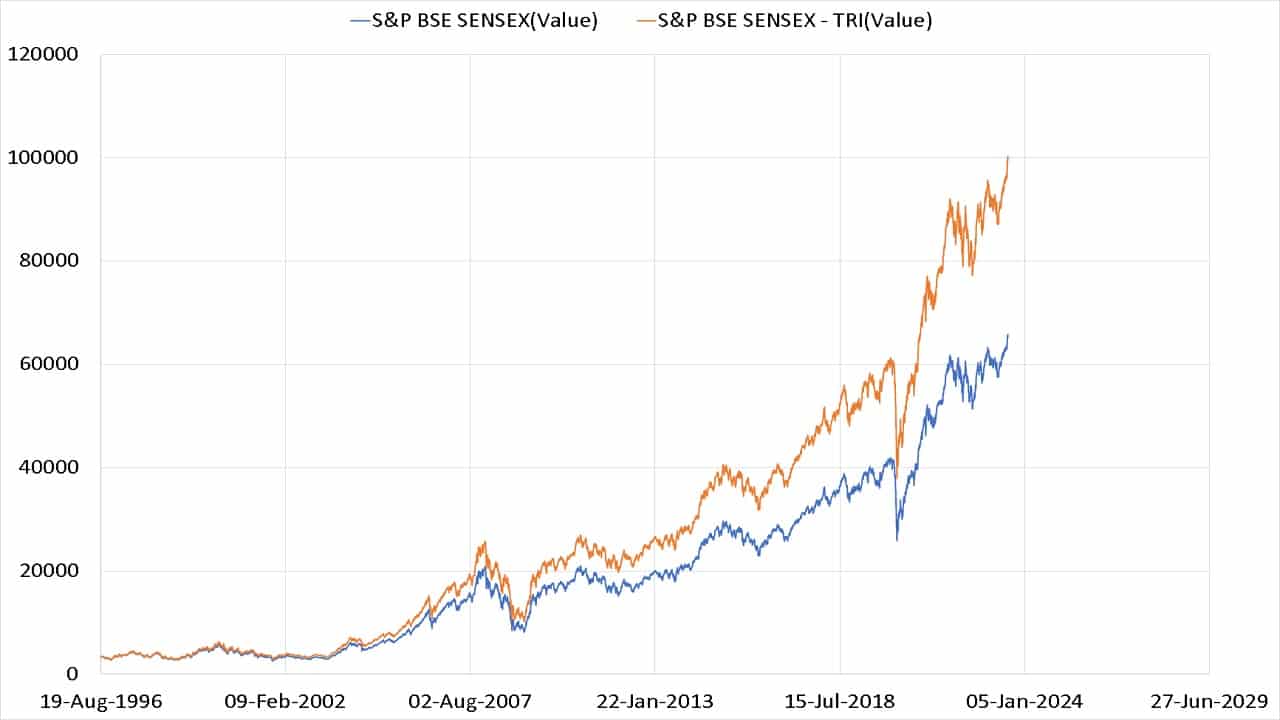
Let us first look at the evolution of the two indices. Dividends have a big role to play. We have already discussed this for the S&P 500: The magic of reinvested stock dividends!
These are the ten-year rolling returns.
🔥Secure your future with our Robo-advisory tool trusted by over 3,500 investors and advisors. From effortless retirement planning to funding your children’s biggest dreams, turn your financial goals into reality. 🔥
Subscribe for money management solutions via email! (Link takes you to our email sign-up form) Join 32,000+ readers in our community.
👉 New Tool Alert! NaviPlan: A Privacy-Focused Multi-asset Tracker and Goal Planner 👈
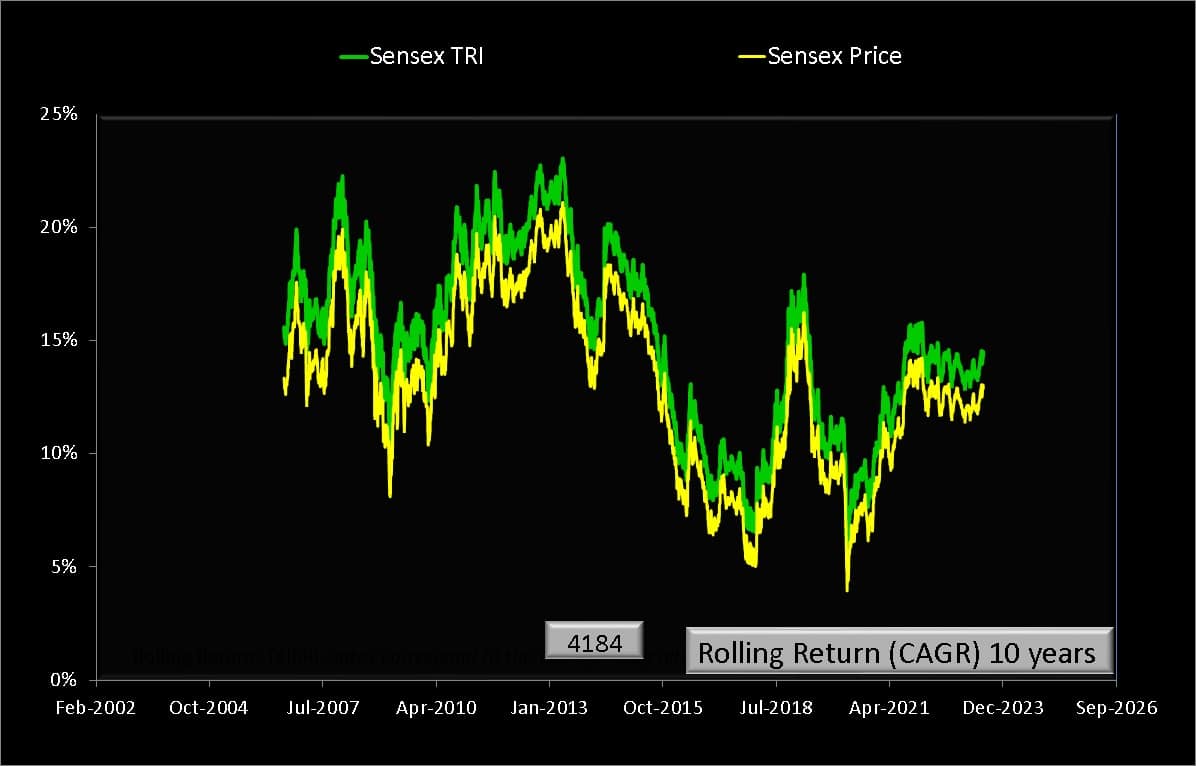
What return can I get over ten years of equity investing? The honest, data-driven answer is no one knows! The solution to this uncertainty is goal-based portfolio management.
This is the return difference over ten years.
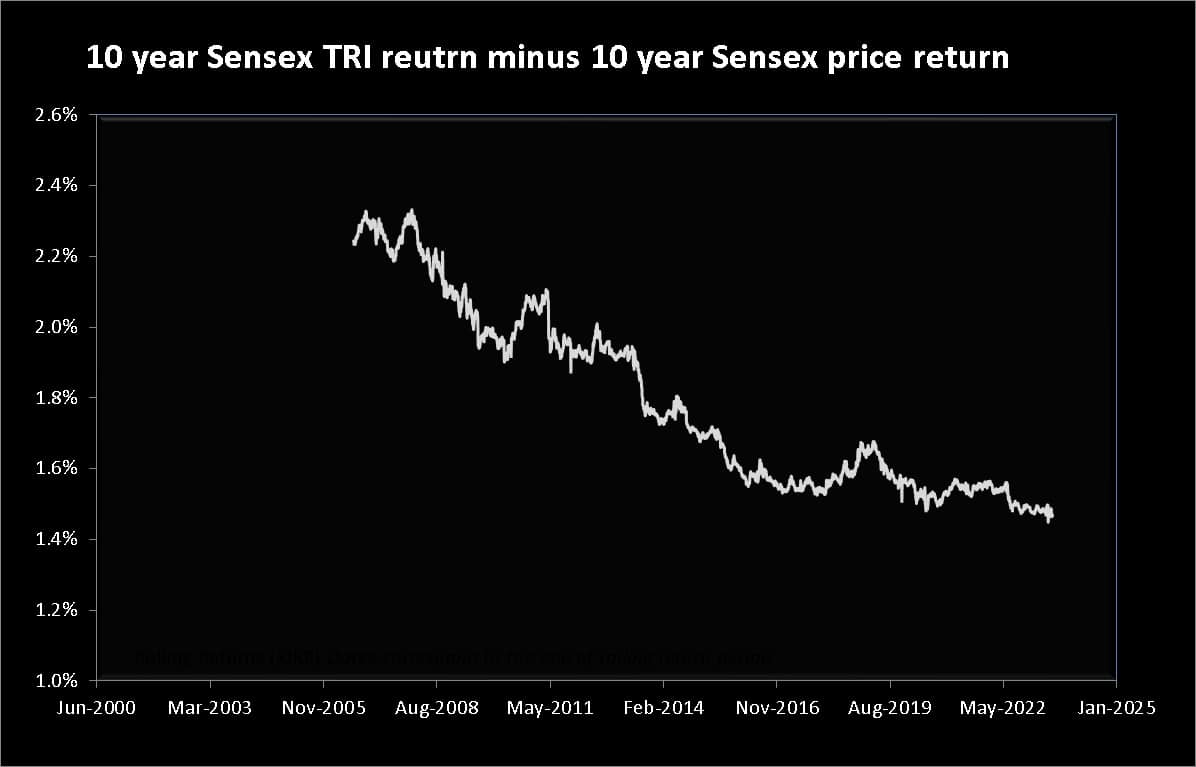
Notice that the dividend contribution has distinctly decreased. There is no point taking the “average” of this set when the spread is so wide.
These are the 15-year rolling returns.
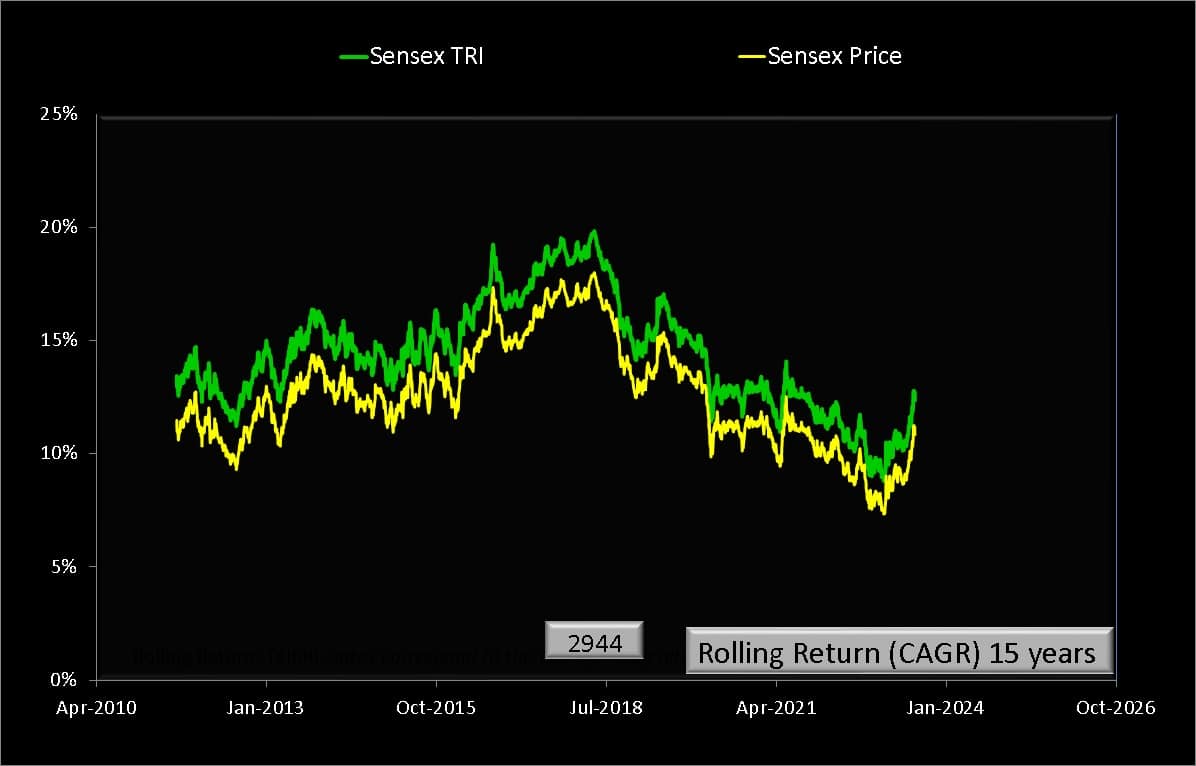
The above “no one knows” still applies over 15 years.
This is the return difference over 15 years.
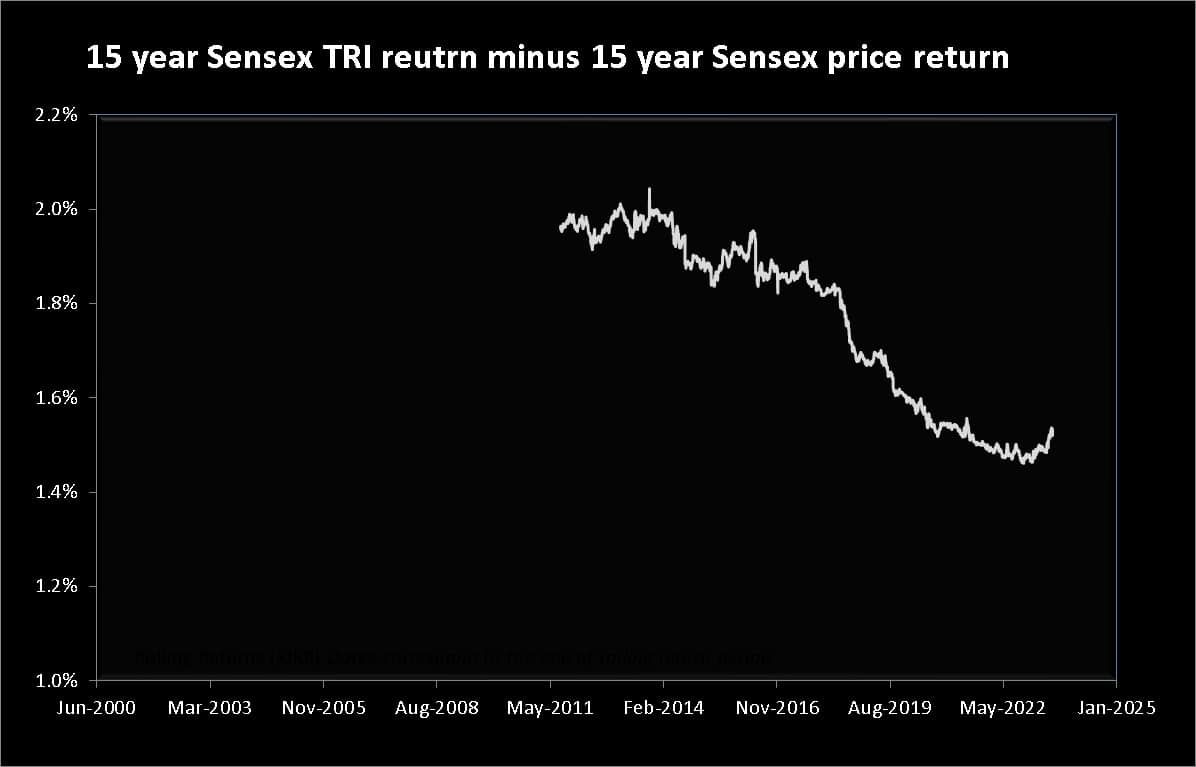
The same trend as above is seen over 15 years too.
In summary, adding a constant 2% to the Sensex price return is technically incorrect in representing the effect of dividends. However, that 2% represents an error on the side of caution when trying to learn about past risk and, therefore, reasonable with the above data acting as a caveat.