When people say, “Over the long term, equity will provide good returns”, they often forget or do not want to consider how monthly or annual return sequences combine to result in the final annualized return (CAGR). Sometimes, the sequence of returns can be good or bad.
This is known as sequence of returns risk, sequence risk or timing luck. Understanding and minimising this is essential to investing success. With a simple example, we discuss what is a sequence of returns risk and how it affects the corpus during the accumulation phase (when we are investing towards it) and during the withdrawal phase (when we use the corpus to generate an income from it, after retirement)
Sequence of returns risk essentially means the following: We plan with an annualized return on a spreadsheet. This implies that the annual return year after year is the same in the calculation. There is no other way around it. The annual returns in equity (or gold or bonds) are different. Sometimes, you get + 25% and sometimes -40%. When these annual returns combine, they produce high, low or mediocre returns. How does this happen? What is the solution?
Lump sum investment growth at a constant return
Suppose you wish to invest Rs. one lakh for 15 years and assume an annualized return of 10% (from equity alone). This means that you assume Rs. one lakh will grow yearly.
| Year | Return Assumed | Year-end corpus |
| 1 | 10% | 1,10,000 |
| 2 | 10% | 1,21,000 |
| 3 | 10% | 1,33,100 |
| 4 | 10% | 1,46,410 |
| 5 | 10% | 1,61,051 |
| 6 | 10% | 1,77,156 |
| 7 | 10% | 1,94,872 |
| 8 | 10% | 2,14,359 |
| 9 | 10% | 2,35,795 |
| 10 | 10% | 2,59,374 |
| 11 | 10% | 2,85,312 |
| 12 | 10% | 3,13,843 |
| 13 | 10% | 3,45,227 |
| 14 | 10% | 3,79,750 |
| 15 | 10% | 4,17,725 |
Reality: Sequence of returns risk
It should be clear that 10% year on year is pure fantasy. Consider a real 15-year sequence considered in a past study – How to reduce risk in an investment portfolio:
🔥Secure your future with our Robo-advisory tool trusted by over 3,500 investors and advisors. From effortless retirement planning to funding your children’s biggest dreams, turn your financial goals into reality. 🔥
Subscribe for money management solutions via email! (Link takes you to our email sign-up form) Join 32,000+ readers in our community.
👉 New Tool Alert! NaviPlan: A Privacy-Focused Multi-asset Tracker and Goal Planner 👈
-18%, -5%, 20%, -27%, 52%, -18%, -22%, -3%, 69%, 22%, 43%, 95%, 35%, -55%, 86%
Now, that Rs. 1 lakh would “grow” as follows
| Year | Actual return | Year-end corpus |
| 1 | -18% | 82,000 |
| 2 | -5% | 77,900 |
| 3 | 20% | 93,480 |
| 4 | -27% | 68,240 |
| 5 | 52% | 1,03,725 |
| 6 | -18% | 85,055 |
| 7 | -22% | 66,343 |
| 8 | -3% | 64,352 |
| 9 | 69% | 1,08,756 |
| 10 | 22% | 1,32,628 |
| 11 | 43% | 1,89,657 |
| 12 | 95% | 3,69,832 |
| 13 | 35% | 4,99,273 |
| 14 | -55% | 2,24,673 |
| 15 | 86% | 4,17,892 |
Notice something bizarre? The final amount is the same in both cases!! How is this possible?
1 L x (1+10%)^15 = 4.17 Lakh. Here, ^15 means (1+10%) is multiplied by itself 15 times, just as 2^3 = 2 x 2 x 2.
Instead of multiplying the same assumed return each year, it could be different for each year.
1 L x (1-18%)x(1-5%)x(1+20%)x(1-27%)x(1+52%)x(1-18%)x(1-22%)x(1-3%)x(1+69%)x(1+22%)x(1+43%)x(1+95%)x(1+35%)x(1-55%)x(1+86%) = 4.17 Lakh.
The math in both cases may have resulted in the same corpus, but there is one big difference – human emotions and behaviour. The return after one year is – 18%. How many people will still stick with equity?
Even if they do, the return after year 2 is -5%!! When investing or during the accumulation phase, the sequence of returns risk governs human behaviour. The corpus will be the same if the final annualized return is the same as the one assumed. However, the annual returns decide whether we stay invested or exit.
Deriving income from Rs. 50 lakh for 15 years
Suppose we have Rs. 50 lakh with us, and we wish to derive an income that increases each year at 6% (assumed inflation). Before the start of each year, we withdraw the annual expenses required for that year and assume the rest of the amount grows at an assumed return of 10%. The year-end corpus will decrease, as shown below.
| Annual Expenses | Assumed Return | Year-end corpus |
| 3,60,000 | 10% | 51,04,000 |
| 3,81,600 | 10% | 51,94,640 |
| 4,04,496 | 10% | 52,69,158 |
| 4,28,766 | 10% | 53,24,432 |
| 4,54,492 | 10% | 53,56,934 |
| 4,81,761 | 10% | 53,62,690 |
| 5,10,667 | 10% | 53,37,226 |
| 5,41,307 | 10% | 52,75,511 |
| 5,73,785 | 10% | 51,71,898 |
| 6,08,212 | 10% | 50,20,054 |
| 6,44,705 | 10% | 48,12,884 |
| 6,83,387 | 10% | 45,42,446 |
| 7,24,391 | 10% | 41,99,861 |
| 7,67,854 | 10% | 37,75,207 |
| 8,13,925 | 10% | 32,57,410 |
Even if the expenses increase 6% yearly, since the corpus grows at the same annual return of 10%, we will still have 32 Lakh left after 15 years.
The reality: How varying returns can diminish a corpus
Now, introduce variable returns as discussed above.
| Expenses | Actual Returns | Actual end corpus |
| 3,60,000 | -18% | 38,04,800 |
| 3,81,600 | -5% | 32,52,040 |
| 4,04,496 | 20% | 34,17,053 |
| 4,28,766 | -27% | 21,81,450 |
| 4,54,492 | 52% | 26,24,976 |
| 4,81,761 | -18% | 17,57,436 |
| 5,10,667 | -22% | 9,72,480 |
| 5,41,307 | -3% | 4,18,238 |
| 5,73,785 | 69% | |
| 6,08,212 | 22% | |
| 6,44,705 | 43% | |
| 6,83,387 | 95% | |
| 7,24,391 | 35% | |
| 7,67,854 | -55% | |
| 8,13,925 | 86% |
The corpus has now run out in 8 years!!
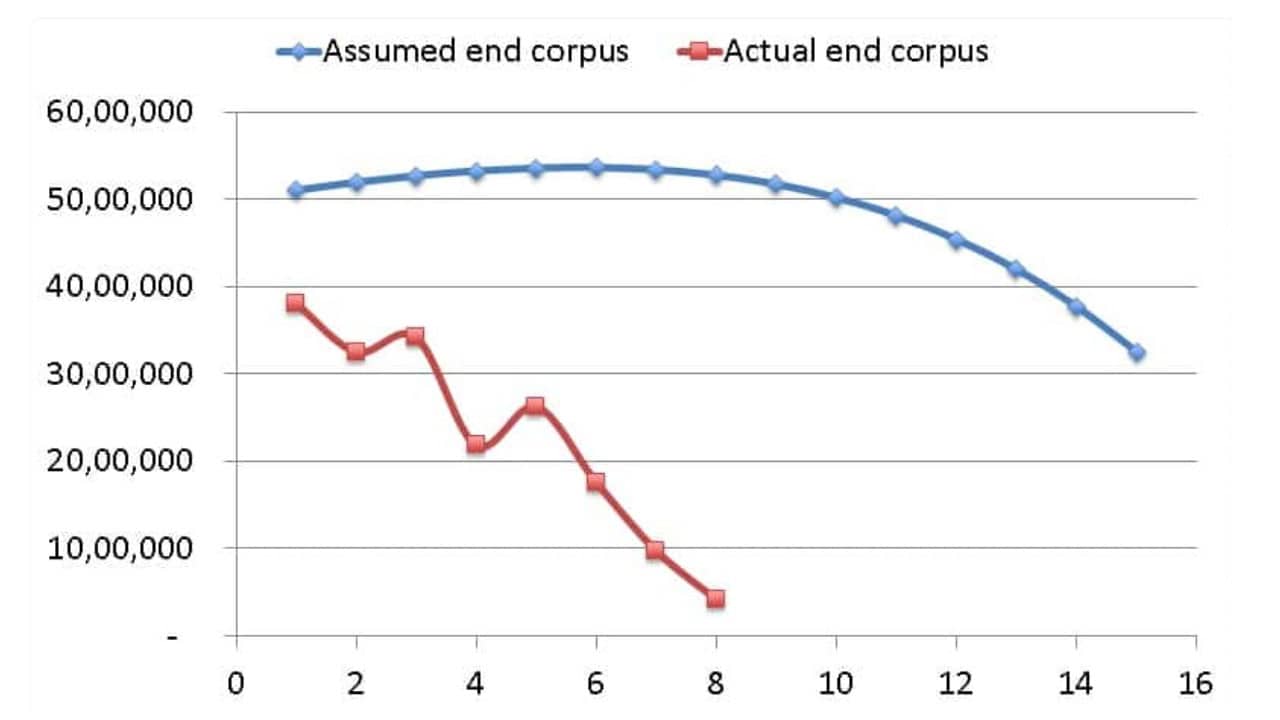
Notice that a sequence of returns risk can fail when you are accumulating a corpus due to bad portfolio management and investor behaviour. The withdrawal phase after retirement results in an error in the actual calculation! This is far more dangerous as one could get away with an assumed return in the accumulation phase.
Video version
What is the solution?
Proper asset allocation and step-wise reduction in equity well before the goal deadline. The Freefincal Robo Advisor Tool takes care of this automatically and gives you clear directions on how much to invest in which asset class and how to vary your asset allocation each year, depending on your personal circumstances. It helps effectively minimise sequence risk in both the accumulation and withdrawal phases of investing.