Last Updated on August 22, 2022 at 11:26 pm
In this article, we compare the performance of the Nifty 100 Low volatility 30 Total Return Index with the Nifty 50 Total Return Index. The 5-year and 10-year return differences between these indices are currently at an all-time low.
The Nifty 100 low volatility 30 index consists of 30 large cap stocks from the Nifty 100 universe with the lowest price volatility over the last year. The stocks with the lowest volatility have the highest weight, but the index historically has many stocks with comparable weights, unlike a market capitalization based index like NIfty 50 or Nifty 100/500.
We have discussed the low volatility index in detail earlier, pointing out that it is one of the simplest ways to pick stocks. See: Low volatility stock investing – Does it work? And Select your first stock without breaking your head! Here is how. And ICICI Prudential Nifty Low Vol 30 ETF FOF Review.
This is the since inception evolution of the NIfty 100 low volatility 30 and NIfty 50 total return indices. As usual, a deep analysis is necessary.
🔥Secure your future with our Robo-advisory tool trusted by over 3,500 investors and advisors. From effortless retirement planning to funding your children’s biggest dreams, turn your financial goals into reality. 🔥
Subscribe for money management solutions via email! (Link takes you to our email sign-up form) Join 32,000+ readers in our community.
👉 New Tool Alert! NaviPlan: A Privacy-Focused Multi-asset Tracker and Goal Planner 👈
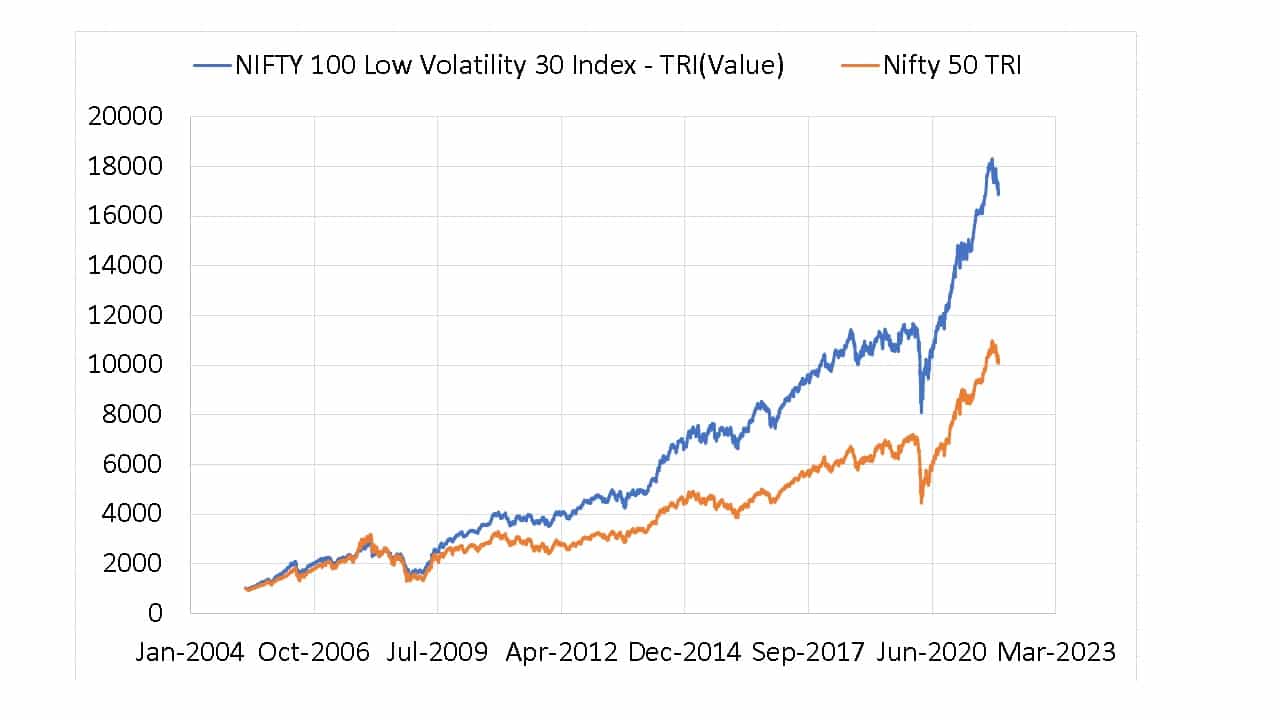
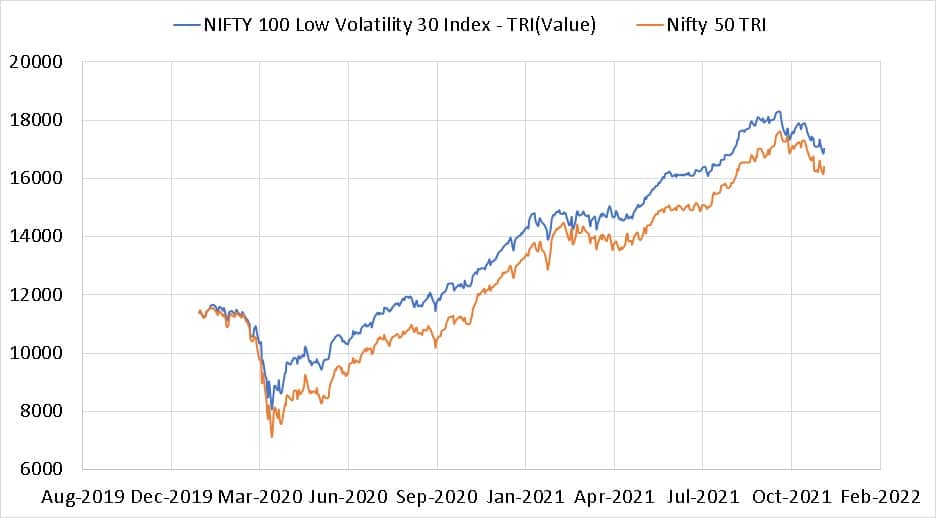
We also publish Retirement Stock Portfolio Analysis based primarily on a low volatility strategy each month. In Sep 2021, the absolute return of the stock portfolio *(incl dividends) was 41.13%, while an equivalent investment in the UTI Nifty Index fund was 28.86%. After just one month, this return difference shrunk to just about 1.5% triggering this analysis (since then, the Nifty has fallen too).
This can also be seen from the following graph.
Next, we shall look at the differences in 1-year, 5-year and 10-year rolling returns. That is Nifty 100 Low Volatility 30 return minus Nifty 50 return.
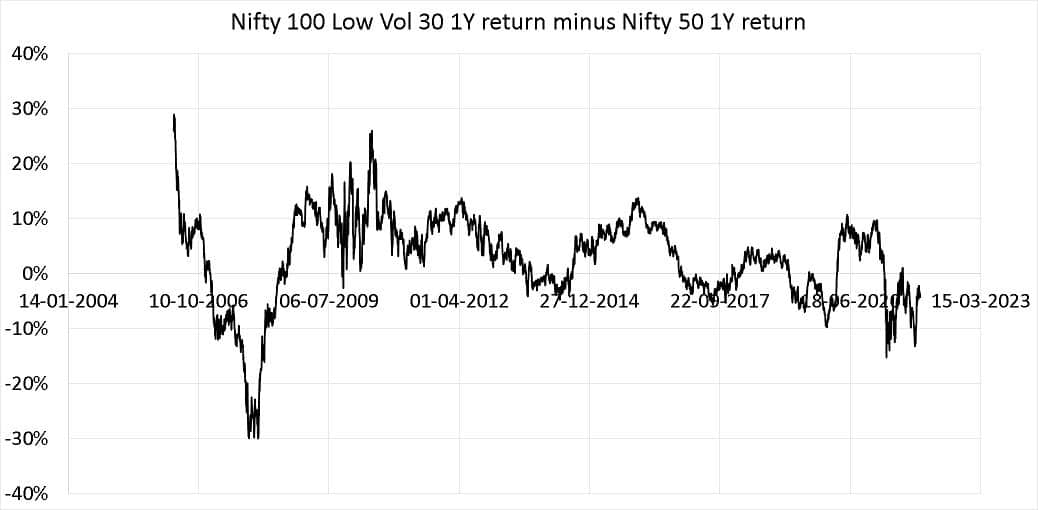
Notice that the1Y return difference is currently the second-lowest after the 2008 crash.
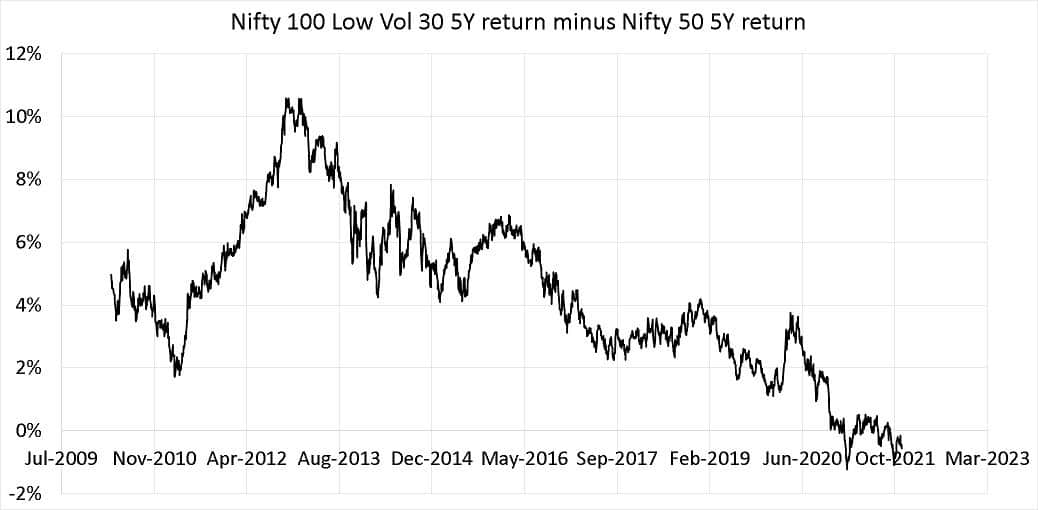
The 5Y return difference hit an all-time low earlier this year and is currently close to that value. For the first time, the 5Y return of the low volatility index is lower than that of the Nifty 50.
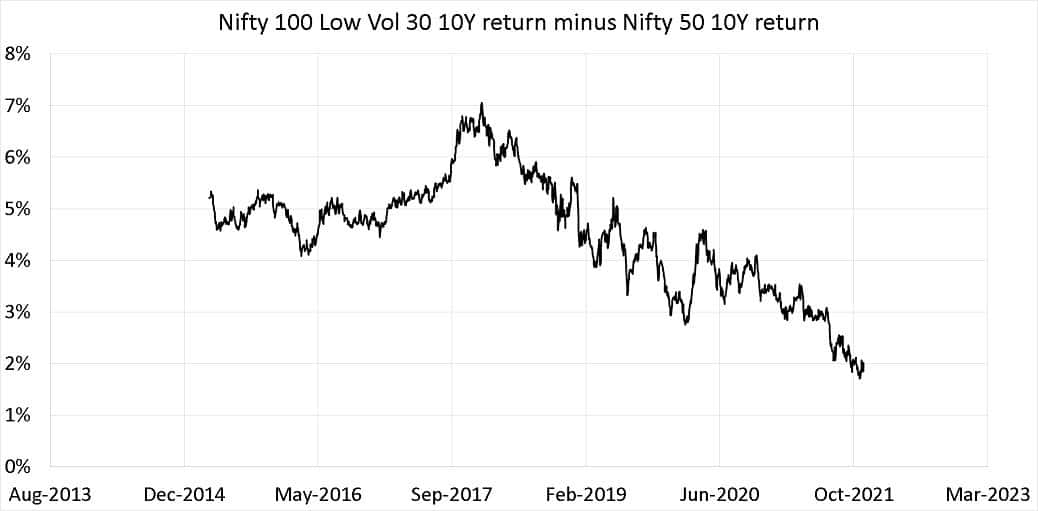
The 10Y return difference is still positive (the low volatility index has outperformed Nifty), but the value is at an all-time low.
What do these results mean? We have earlier pointed out that the factor indices have a short history, with much of it backtested. We may see evidence of the inevitable in the Indian context: No strategy outperforms forever. There will always be cyclic ups and down relative to a market-cap-weighted index. While low volatility fans are guaranteed lower volatility, they must appreciate that they will not always (also) get higher returns.