Last Updated on December 18, 2021 at 10:44 pm
If my financial goal is 15-plus years away, PPF is an obvious and pretty good choice for a debt instrument while trying to put together a diversified portfolio. ‘Which debt mutual fund should I choose for the same purpose, if my goal is less than 15 years away?’, is a question that is asked often enough.
The answer had presented itself to us earlier in an earlier post: Debt Mutual Fund Returns: How to expect when you are expecting!
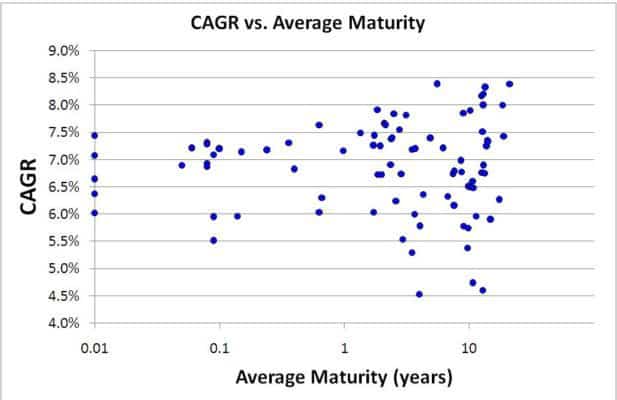
I was quite astonished to see debt funds with high average maturity (typically medium and long-term gilt funds) had a 10 year CAGR comparable to liquid funds!
🔥Secure your future with our Robo-advisory tool trusted by over 3,500 investors and advisors. From effortless retirement planning to funding your children’s biggest dreams, turn your financial goals into reality. 🔥
Subscribe for money management solutions via email! (Link takes you to our email sign-up form) Join 32,000+ readers in our community.
👉 New Tool Alert! NaviPlan: A Privacy-Focused Multi-asset Tracker and Goal Planner 👈
So why bother taking on volatility that does not pay? Why not be content with simple accrual type ultra-short term funds? As reader Deep pointed out in response to this graph, “no brainer to go for liquid funds as both credit risk and volatility risk are lowest”.
Let us now look at returns of all debt mutual funds categorized as per Value Research Online. The horizontal axis represents the number of mutual funds in each category and is not shown. Data is take from Value Research.
Last 10 year CAGR
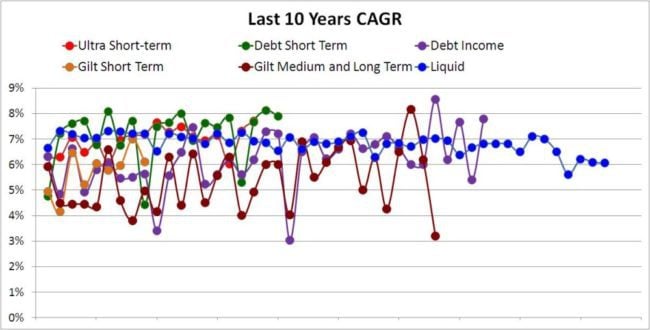
Notice that liquid fund returns of all mutual funds are typically the same. So it does not matter which AMC you choose. What a relief! of course, this is just one data point. If we stare at rolling returns, there will be some variation (see below).
Clearly funds with low average maturity (liquid, ultra short-term and short-term) are less volatile across AMCs. Many comfortably best the Debt-Income (including dynamic bond funds), Gilt-Short-term and Gilt-Medium and Long-term categories.
7 year average CAGR
Here is the average of the rolling 7 year CAGR.
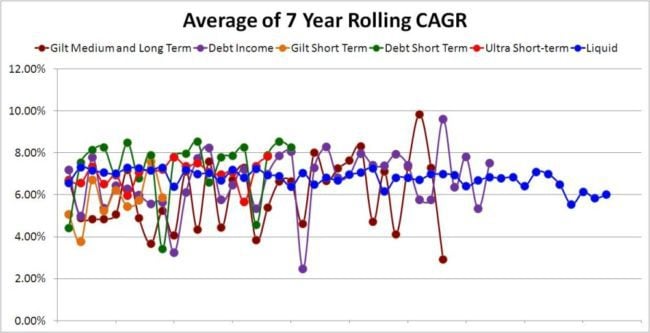
Note: It is unfair to include funds that hold bonds with maturity period greater than the duration over which we calculate returns. Therefore, when the duration is decreased the long-term funds lose relevance. However, I have included them in the graphs for an overall perspective.
Amusingly, this graph (and the ones to come) look similar to the 10Y return graph! The conclusions do not change!
5 year average CAGR
Average of the rolling 5 year CAGR.
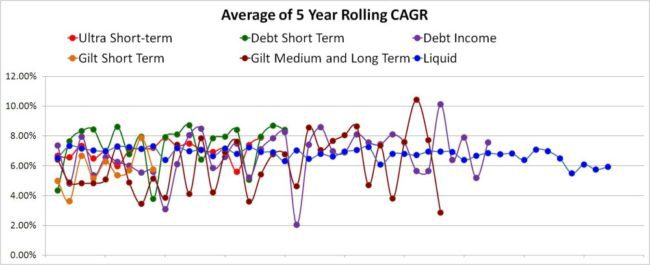
Again, you can buy a liquid fund, liquid-plus fund or ultra short-term fund and relax!
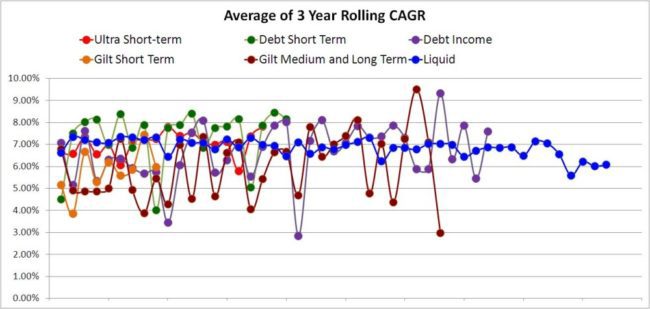
3 year average CAGR
Average of the rolling 3 year CAGR.
Bottom Line
The next time an ‘expert’ says, ‘match the average maturity of a debt fund with the duration of your financial goal’, Let us ignore them!
Let us now look at rolling returns of two funds: a long-term gilt fund and a liquid fund.
Long-term Gilt fund
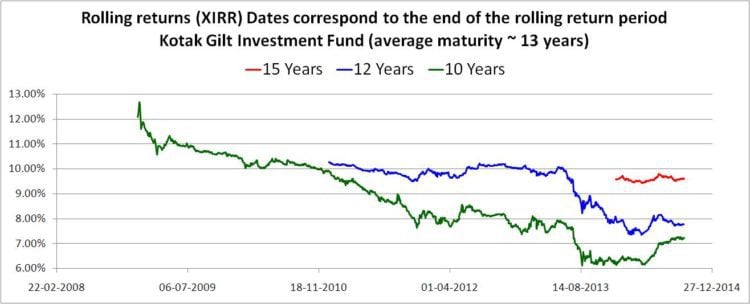
Notice the progressive decrease in returns. The 15 year returns are steady but not spectacular. Considering the volatility and associated emotional stress, I don’t think they are good enough.
Perhaps since the economy is supposedly reviving as we speak, interest rates will fall and the gilts will shine again!
However, 10+ years is more than one market cycle. So what one gains when rate fall, one could lose when they rise again! I am no expert, but I am willing to wager that this is the reason long-term gilt funds, if held for a long time, fail to impress.
Liquid Fund
Liquid funds are not angels either! Their returns can vary quite a bit.
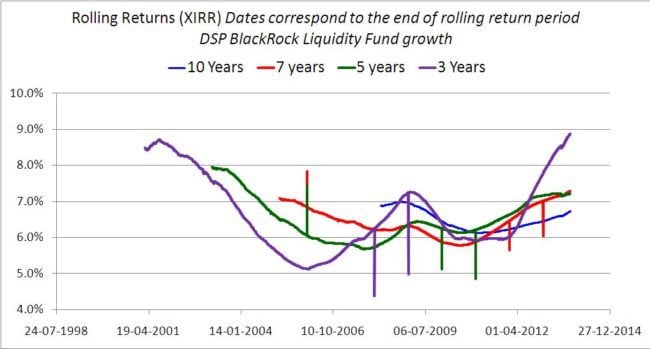
Please do not believe any ‘expert’ who says that liquid funds are better than fixed or recurring deposits. There is no guarantee that post-tax liquid fund returns would beat post-tax FD returns, irrespective of the duration. For ‘short time periods, liquid funds are suitable when the redemption date and amount are uncertain.