Over the years, readers have often asked us how the risk of uncertain returns from a mutual fund investment can be lowered. We have often said the solution is goal-based systematic risk management. Here is an illustration. We described the steps in a previous article: How to systematically reduce risk in your investment portfolio.
A reader also recently asked, “What is the use of fixed-income instruments for a long term goal?” So let us start with a 100% equity portfolio.
We will consider 343 15-year intervals from 1979 to 2022. We shall use Sensex price data, a fixed-income instrument offering 7% yearly. Sensex dividends will enhance the returns seen below by about 2%. However, this is not relevant to our objective.
The returns for each of those 343 15-year windows are shown below.
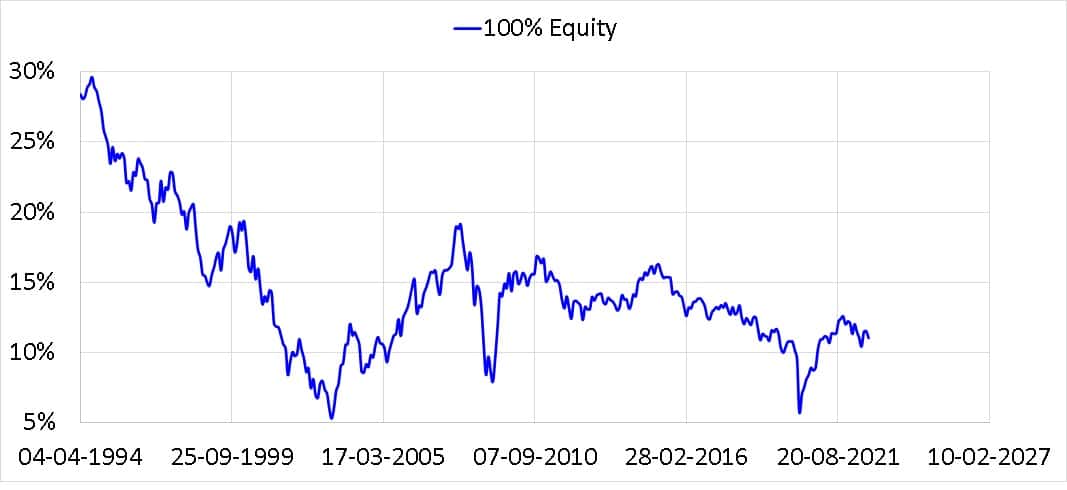
The spread in possible returns is quite large. As the saying goes, you can expect whatever return you want, but the market gives what it feels like. The above data also explains why one should not hold 100% equity. The fate of your investments would be down to a potluck.
🔥Secure your future with our Robo-advisory tool trusted by over 3,500 investors and advisors. From effortless retirement planning to funding your children’s biggest dreams, turn your financial goals into reality. 🔥
Subscribe for money management solutions via email! (Link takes you to our email sign-up form) Join 32,000+ readers in our community.
👉 New Tool Alert! NaviPlan: A Privacy-Focused Multi-asset Tracker and Goal Planner 👈
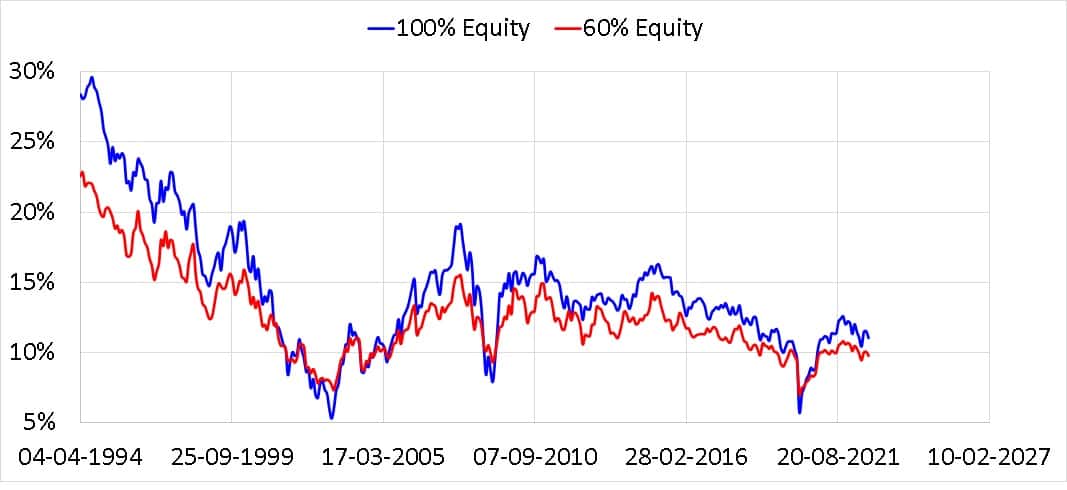
The goal of risk management is to reduce this return volatility. Asset allocation is the first step. If we add 40% fixed income, notice how the return spread decreases.
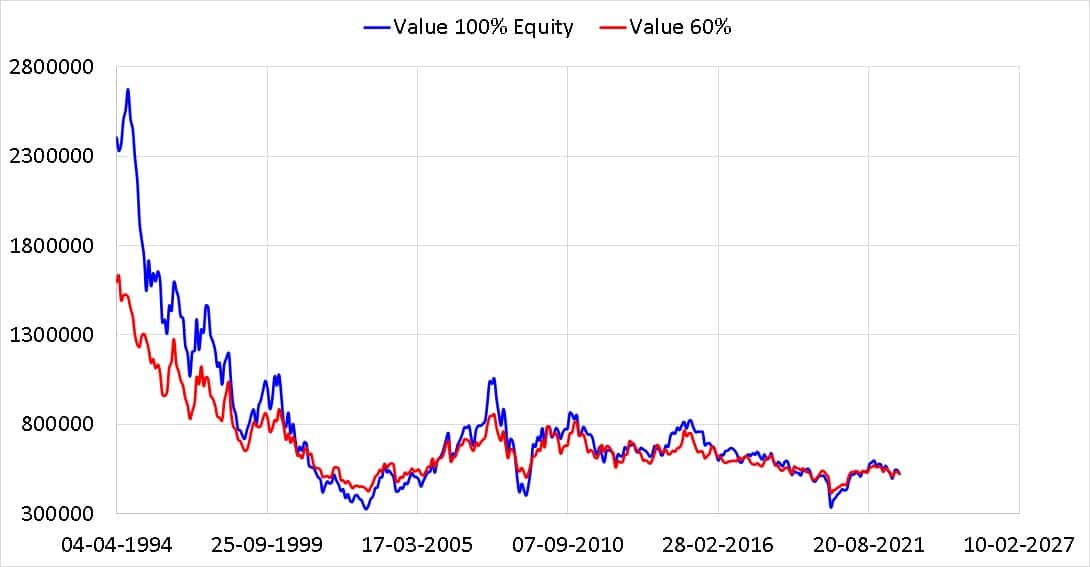
Assuming the goal is to accumulate Rs. 5 Lakhs after 15 years, the spread in final corpus values is shown below.
If we zoom in a bit, we can see the 5L target and how the portfolio value fluctuates.
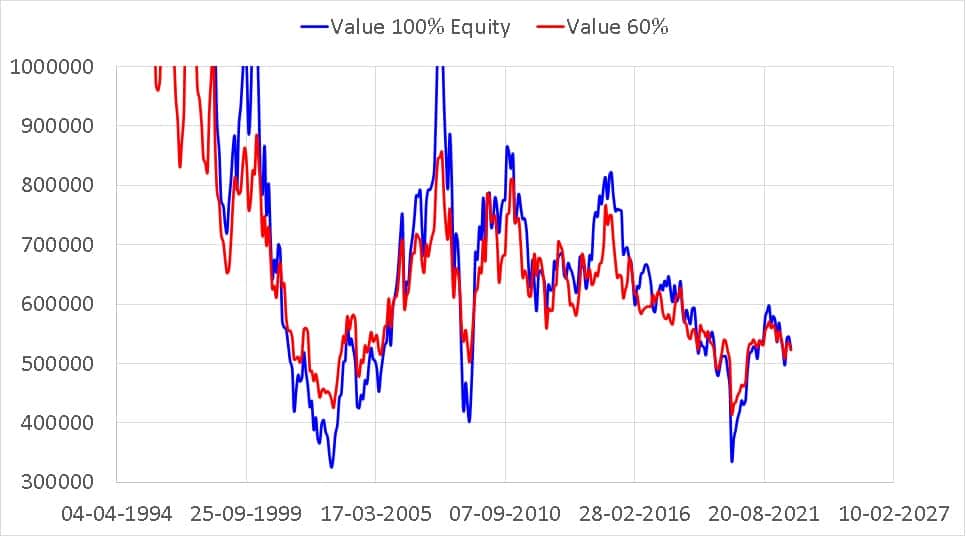
Do not assume “most of the final corpus values are above Rs. 5 lakhs even at 100% equity.” This occurs only because our market history is short. As we demonstrate in our goal-based investing course, failure is much more frequent when considering more than a century of US market history.
Even in this short history, we notice some big failures (final corpus well below five lakhs). The 60% equity and 40% fixed income portfolio reduces the spread in returns, but it fails big, too. Can we do better?
We can consider a step-wise reduction in equity as recommended by the freefincal robo advisory tool. We shall refer to this as glide path 1.
| Year of investment | Suggested Equity allocation |
| 1 | 50% |
| 2 | 50% |
| 3 | 50% |
| 4 | 50% |
| 5 | 50% |
| 6 | 50% |
| 7 | 45% |
| 8 | 40% |
| 9 | 35% |
| 10 | 30% |
| 11 | 25% |
| 12 | 19% |
| 13 | 13% |
| 14 | 6% |
| 15 | 0% |
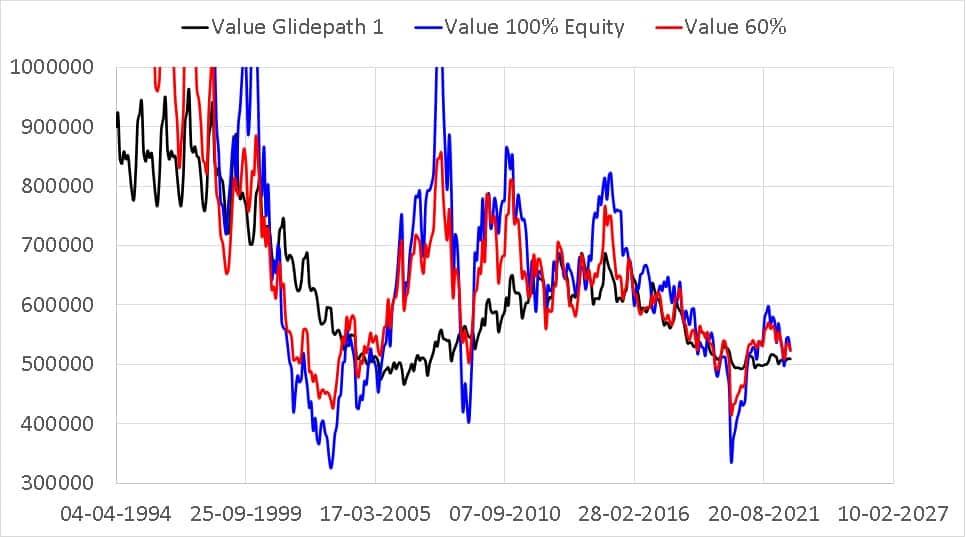
This eliminates the big failures. Another option is to reduce equity continuously (glide path 2), reducing the spread and number of failures.
| Year of investment | Suggested Equity allocation |
| 1 | 60.00% |
| 2 | 52.80% |
| 3 | 46.46% |
| 4 | 40.88% |
| 5 | 35.97% |
| 6 | 31.65% |
| 7 | 27.85% |
| 8 | 24.51% |
| 9 | 21.57% |
| 10 | 18.98% |
| 11 | 16.70% |
| 12 | 14.70% |
| 13 | 12.93% |
| 14 | 11.38% |
| 15 | 10.01% |
Many may dismiss these glide paths as “too conservative”, but they have a reasonable chance of success compared to conventional ideas. Most importantly, they work regardless of market conditions.
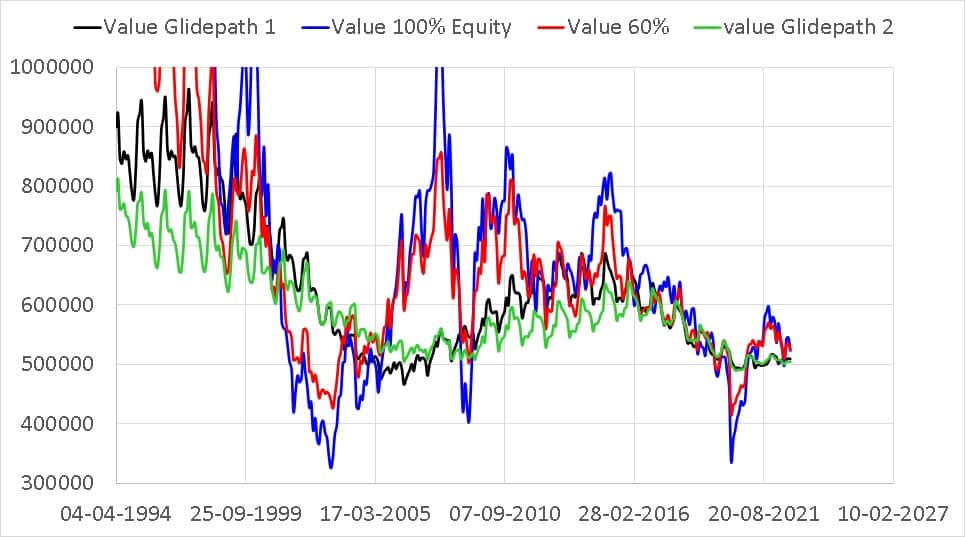
The step-wise reduction recommended by the freefincal robo advisory tool is a suitable intermediate between “conventional” ideas that often fail and “caution”.
This is the full range of XIRRs for all four strategies. The investment amount required for each strategy was adjusted suitably with a 10% return expectation from equity and 7% from fixed income.
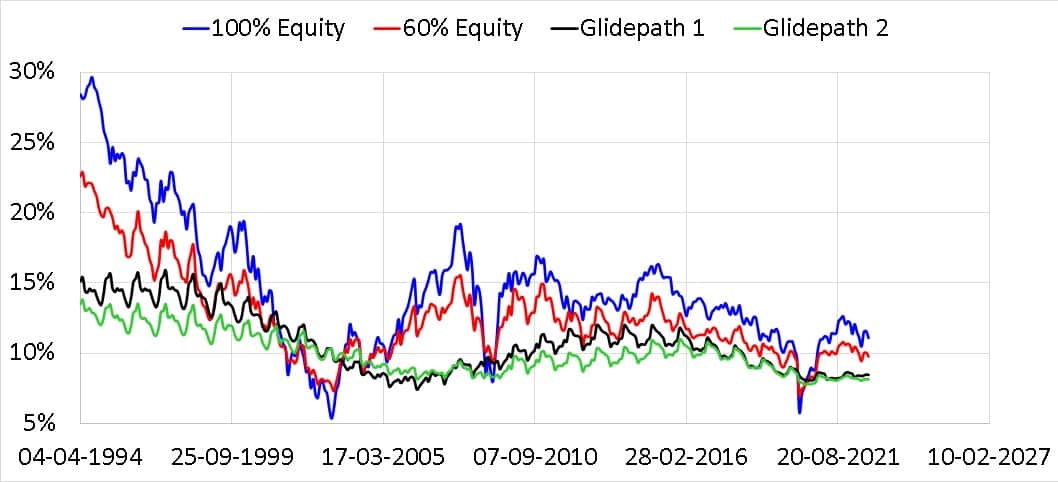
Our simulations do not include fixed-income volatility. This may enhance returns (due to regular rebalancing) at the cost of a slightly higher return spread.
A standard “de-risking” strategy advisors recommend is constantly holding 50-60% equity and reducing it over the last three years before the goal deadline. As shown below, this advice is quite risky. The spread in portfolio value is quite high, with the possibility of big failures.
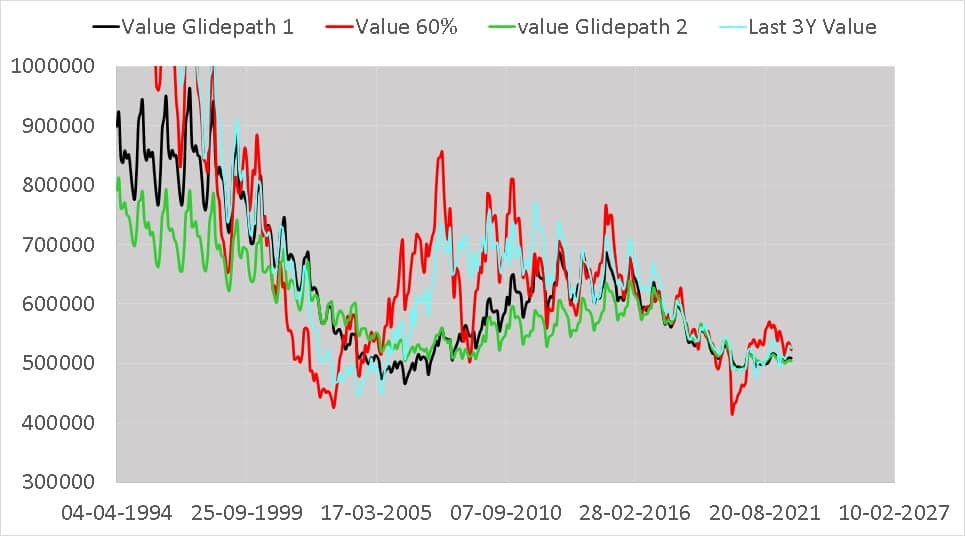
The step-wise equity reduction (glide path 1) or the continuous equity reduction (glide path 2) is superior in avoiding big failures (due to a poor sequence of return). The range of possible XIRRs and portfolio values is also narrower, making the investment journey smoother.
In summary, we have shown ways to reduce the volatility and uncertainty of mutual fund returns allowing us to create a goal-based market-independent investment strategy.
The benefits of doing this are obvious. We invest systematically and manage risk in the portfolio, regardless of market conditions. There is no need to follow market news or market valuations. No need to take media “experts” seriously and worry about what to do. Once set up, the systematic management can be run on auto-pilot with no more than 30 minutes of portfolio review once a year! You can get started with this free seminar: Basics of portfolio construction: A beginner’s guide.