Last Updated on August 22, 2022 at 11:29 pm
SBI ETF Nifty 50, thanks to contributions by the EPFO since late 2015 has emerged as the largest ETF and the largest mutual fund in the country. We ask if it makes sense to choose this over UTI Nifty Index fund (direct plan).
SBI ETF Nifty 50 with a total expense ratio of 0.07% is not the cheapest ETF, but it is still 30% less expensive than the most low-cost index fund (as on date): UTI Nifty which costs 0.1%. On the face of it, this looks like a no-brainer decision: go with the cheapest product.
Investors assume expenses and tracking error are good ways to choose index funds and ETFs. Sadly there is no uniform way to report tracking errors and even what is available is hard to find and compare.
🔥Secure your future with our Robo-advisory tool trusted by over 3,500 investors and advisors. From effortless retirement planning to funding your children’s biggest dreams, turn your financial goals into reality. 🔥
Subscribe for money management solutions via email! (Link takes you to our email sign-up form) Join 32,000+ readers in our community.
👉 New Tool Alert! NaviPlan: A Privacy-Focused Multi-asset Tracker and Goal Planner 👈
Also comparing the tracking error of an ETF with an index fund is wrong because the ETF’s NAV is used for the calculation. Investors often tend to forget that, unlike a mutual fund, the ETF has two components – the price and NAV.
The price of an ETF is determined by supply and demand among the unitholders. The returns an ETF investor gets is based on buy price and sell price, not the buy-NAV and sell-NAV. Therefore tracking errors and return differences between index and ETF should be computed based on the price information and not NAV.
SBI EFT Nifty 50 Price to NAV percentage difference
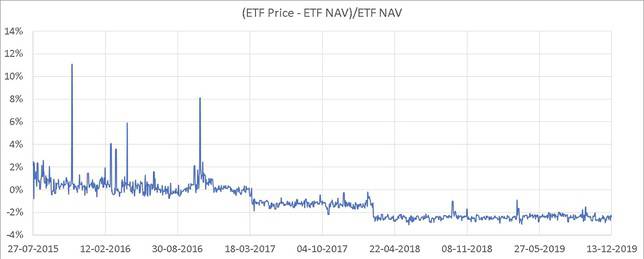
Not so fast! Someone in the unitholder pool has to sell for the investor to buy. Why would anyone willingly sell a lower price? This graph alone should be enough for investors to avoid SBI NIfty 50 ETF.
High AUM is not a positive in an ETF. An ETF with an active intermediary will quickly reduce price-nav deviations. To understand how it works see: Interested in ETFs? Here is how you can select ETFs by checking how easy it is to buy/sell them
Thus in a healthy ETF, the price should move above and below the NAV periodically and quickly.
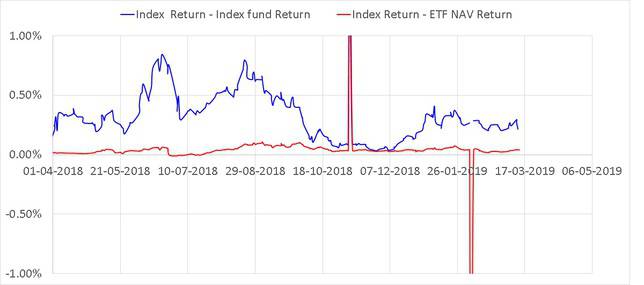
Return Comparison: SBI ETF Nifty 50 NAV vs UTI Nifty Index fund NAV
Blue line: Nifty 50 TRI index return minus UTI Nifty return (quarterly)
Red line: Nifty 50 TRI index return minus SBI ETF Nifty NAV-based return (quarterly)
The spikes are caused by missing NAV/Price data and can be ignored.
Return Comparison: SBI ETF Nifty 50 Price vs UTI Nifty Index fund NAV
Blue line: Nifty 50 TRI index return minus UTI Nifty return (quarterly)
Red line: Nifty 50 TRI index return minus SBI ETF Nifty Price-based return (quarterly)
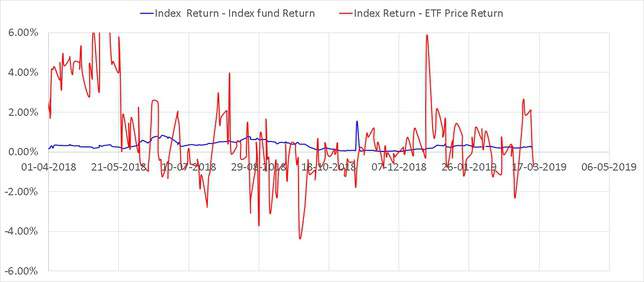
All returns are quarterly (annualized via XIRR function). If you compare the NAVs, the ETF looks better. However, what you buy and sell is the price. Use that, and the picture is quite different.
The ETF price is significantly more volatile, resulting in significant positive and negative departures from the index.
Notice that the red line is often negative. This means ETF Price-based return > Index TRI return. This may seem like a good thing, but remember this is theoretical.
In the real world, if the price is consistently lower than the NAV, there will be more buyers than sellers. This is extremely unhealthy and points to inefficient management.
In conclusion, avoid SBI Nifty 50 ETF. Stick to UTI Nifty 50 Index fund (direct plan).