When investors compare mutual funds, they usually look at trailing returns—1-year, 3-year or 5-year returns displayed on fund factsheets and research portals. While these figures are easy to understand, they represent returns over just one investment period and can be significantly influenced by the choice of start and end dates.
This is why experienced investors and analysts prefer rolling returns over trailing or point-to-point returns. Rather than relying on a single historical period, rolling returns evaluate performance across multiple investment windows, providing a much more reliable measure of a fund’s consistency through different market cycles.
About the author: Jay Sheth is a SEBI-registered investment adviser and a member of Fee-only India, a group of fixed-fee-only advisors. He can be contacted via his website shwealth.in.
However, there is an important distinction to make. Conventional rolling returns are designed to evaluate lump-sum investments. They assume an investor invests a single amount on one date and remains invested for a fixed period. That is very different from how most retail investors invest today.
The overwhelming majority of mutual fund investments now happen through Systematic Investment Plans (SIPs), where money is invested periodically rather than all at once. Since SIPs involve multiple cash flows spread over time, conventional rolling returns cannot accurately capture the experience of a SIP investor. To evaluate systematic investments, we need an extension of the rolling return concept—SIP Rolling Returns.
🔥Secure your future with our Robo-advisory tool trusted by over 3,500 investors and advisors. From effortless retirement planning to funding your children’s biggest dreams, turn your financial goals into reality. 🔥
Subscribe for money management solutions via email! (Link takes you to our email sign-up form) Join 32,000+ readers in our community.
👉 New Tool Alert! NaviPlan: A Privacy-Focused Multi-asset Tracker and Goal Planner 👈
What are SIP Rolling Returns?
SIP Rolling Returns apply the same philosophy as conventional rolling returns, but to systematic investments. Instead of rolling a lump-sum investment across different starting dates, the analysis rolls an entire SIP.
For example, suppose we want to evaluate the 5-year SIP performance of a mutual fund.
Instead of analysing just one SIP, we calculate:
- A 5-year SIP beginning in January 2013
- Another beginning in February 2013
- Another beginning in March 2013
- And so on until the latest possible 5-year SIP
Each SIP generates an XIRR, considering all monthly investments made during that five-year period. The collection of these XIRRs forms the SIP Rolling Return series.
Why Isn’t This Metric Available on Popular Portals?
Despite its usefulness, SIP Rolling Returns are available on very limited mutual fund research portals. Even standard rolling return data is available only on a handful of platforms. Calculating SIP rolling returns is computationally intensive because it requires creating thousands of hypothetical SIPs across different starting dates and calculating the XIRR for each investment period. As a result, investors rarely get access to this analysis, making it difficult to understand how a fund has actually performed for SIP investors.
Our Analysis
We analysed more than 25 mutual funds by constructing SIP Rolling Return datasets from January 2013 to January 2026.
For every fund, we evaluated:
- 3-Year SIP Rolling Returns
- 5-Year SIP Rolling Returns
- 7-Year SIP Rolling Returns
These were then compared with the corresponding conventional rolling returns over the same periods. The complete analysis is available at: www.shwealth.in/siprr
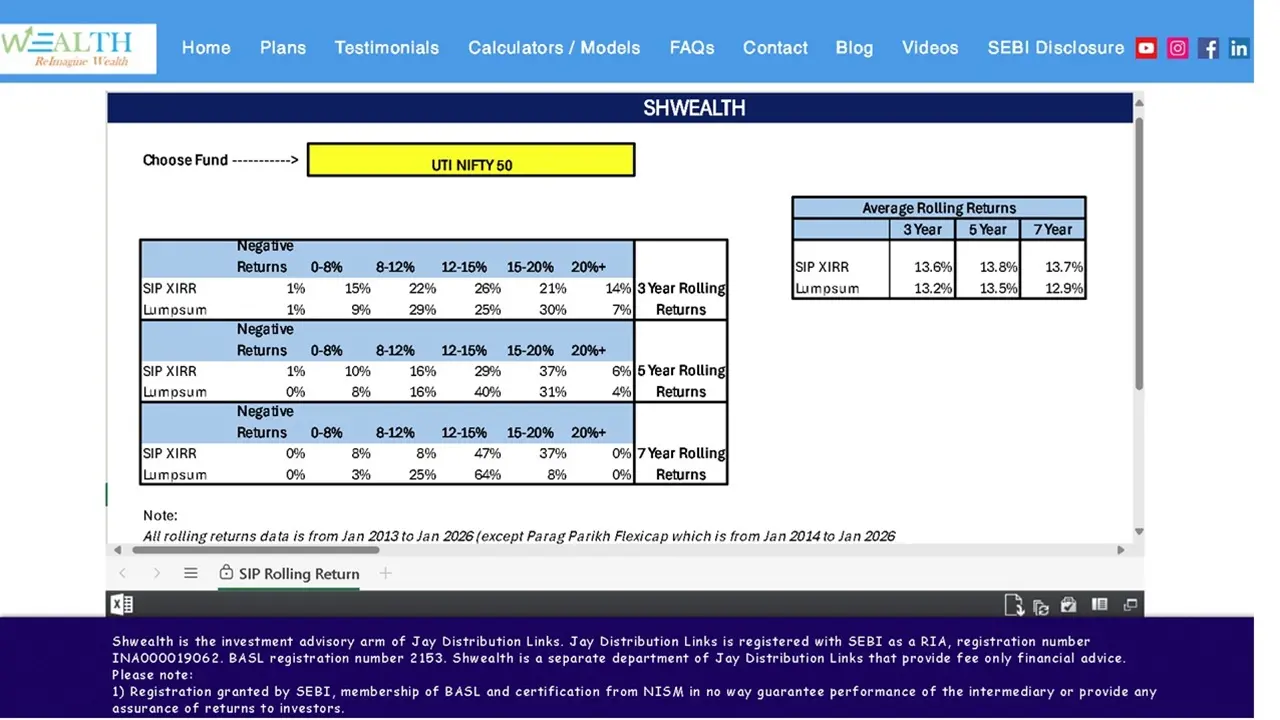
While each fund tells its own story, two broad observations emerged from the study.
Key Observation 1: SIP Rolling Returns Were Consistently Higher
Across the funds analysed, SIP Rolling Returns were typically 0.5% to 1.5% higher than conventional rolling returns.
This finding reinforces one of the fundamental advantages of SIP investing. By investing through different market phases—including corrections—investors accumulate additional units at lower prices. Over longer periods, this disciplined investment approach has historically translated into superior annualised returns compared to equivalent lump-sum investments.
While the exact difference varied across funds and investment horizons, the direction of the result remained remarkably consistent.
Key Observation 2: The Advantage Becomes More Pronounced Over Longer Horizons
For both 3-year and 5-year investment periods, the distribution of SIP Rolling Returns closely resembled that of conventional rolling returns.
However, the picture changed meaningfully when the investment horizon increased to 7 years.
The analysis showed that the probability of earning annualised returns of 20% or more was significantly higher for SIP investors than for equivalent lump-sum investments.
An illustration of this can be seen in the distribution of 7-Year Rolling Returns for HDFC Flexi Cap Fund, shown in Table 1.
Table 1: HDFC Flexi Cap Fund – Distribution of 7-Year Rolling Returns
| Return Distribution | SIP XIRR | Lumpsum |
| Negative Returns | 1.40% | 0.00% |
| 0-8% | 9.50% | 1.40% |
| 8-12% | 8.10% | 13.70% |
| 12-15% | 12.20% | 28.80% |
| 15-20% | 35.10% | 56.20% |
| 20%+ | 33.80% | 0.00% |
Final Thoughts
Rolling returns transformed mutual fund analysis by moving the focus from isolated historical periods to consistency across market cycles.
SIP rolling returns extend the same principle to systematic investing. They answer a different—but equally important—question: How has this fund performed for investors who invested regularly rather than all at once?
As SIPs continue to dominate retail investing, evaluating funds using SIP rolling returns alongside traditional rolling returns provides a more complete and realistic picture of historical performance. Investors who rely on both metrics are better equipped to set expectations, compare funds fairly, and make informed long-term investment decisions.
Disclaimer: Nothing in this article or the model on the website is my solicitation, recommendation, endorsement or offer. Past performance of an index, individual or combination of mutual fund schemes is no guarantee for future performance as to the returns and risks. We do not take any responsibility for investment decisions based on this model; please consult your advisor before taking any decisions on your portfolio construction. Registration granted by SEBI, BASL membership, and NISM certification do not guarantee the intermediary’s performance or provide any assurance of returns to investors. Investment in the securities market is subject to market risks. Read all the related documents carefully before investing.