When we select a mutual fund there are two implicit questions we would like answered. (1) How risky is this fund? (20 How risky is this fund relative to other funds? The mutual fund riskometer is supposed to give us a quick idea about this. Unfortunately, the riskometer has evolved into a cumbersome and unhelpful beast. A discussion on a simple and classic alternative.
It must be understood that the standard deviation is a measure of volatility. It is not an indicator of the underlying cause of the volatility! It cannot measure the latent risk that does not manifest in the fund’s NAV. In other words, volatility is realised risk. There are many other unrealised factors which cannot be quantified via the NAV. See: Basics: What is the difference between risk and volatility?
The current SEBI riskometer has six levels:
i. Low Risk
ii. Low to Moderate Risk
iii. Moderate Risk
iv. Moderately High Risk
v. High Risk and
vi. Very High Risk
There is nothing wrong with these levels but the way in which a fund is assigned a level is quite complex. SEBI directs using market capitalization, impact cost and volatility (among others!) of individual securities for fixing the scheme risk.
🔥Secure your future with our Robo-advisory tool trusted by over 3,500 investors and advisors. From effortless retirement planning to funding your children’s biggest dreams, turn your financial goals into reality. 🔥
Subscribe for money management solutions via email! (Link takes you to our email sign-up form) Join 32,000+ readers in our community.
👉 New Tool Alert! NaviPlan: A Privacy-Focused Multi-asset Tracker and Goal Planner 👈
what is the problem with this? UTI Nifty index fund is marked as “principal will be at very high risk’. if a sectorally diversified index is given the highest risk grade there is no way to differentiate it from a sectoral index which obviously has higher risk.
Also, scheme risk levels can change from month to month which is difficult for most investors to appreciate.
A simpler, stabler alternative is to use the scheme’s standard deviation over a period of time (say the last three years). the standard deviation is a well-known measure of volatility and was most likely used as the primary metric in previous versions of the riskometer.
Volatility as mentioned earlier is a measure of risk after the risk has manifested in the NAV. There are several scheme risks (eg. Credit rating risk; redemptions risk, arbitrage risks) that may not manifest in the NAV but should be considered as risks nonetheless.
SEBI has come up with a separate risk scale based on credit rating (see the above link for details). Cumbersome as it is, it is a step in the right direction. We shall not cover hidden risks in this article. It just so happens that for the time period considered (the last three years) credit rating risks are seen in the NAV.
A risk scale based on scheme standard deviation
- Get the standard deviation of 874 funds over the last 3Y across 58 scheme classifications (some thematic funds are individually classified, hence the large number).
- Find the min and max standard deviation of each category
- Find the simple average of this min and max.
- So now we have a table of categories and avg. standard deviations (see appendix for data)
- Find the average (m) and standard deviation (s) of the above set
- Funds that lie above m+s we classify as very high risk
- Funds that lie between m and m+s we classify as high risk
- Funds that lie between m-s and m we classify as medium risk
- Funds that lie below m-s we classify as low risk
This is a pictorial representation of the classification.
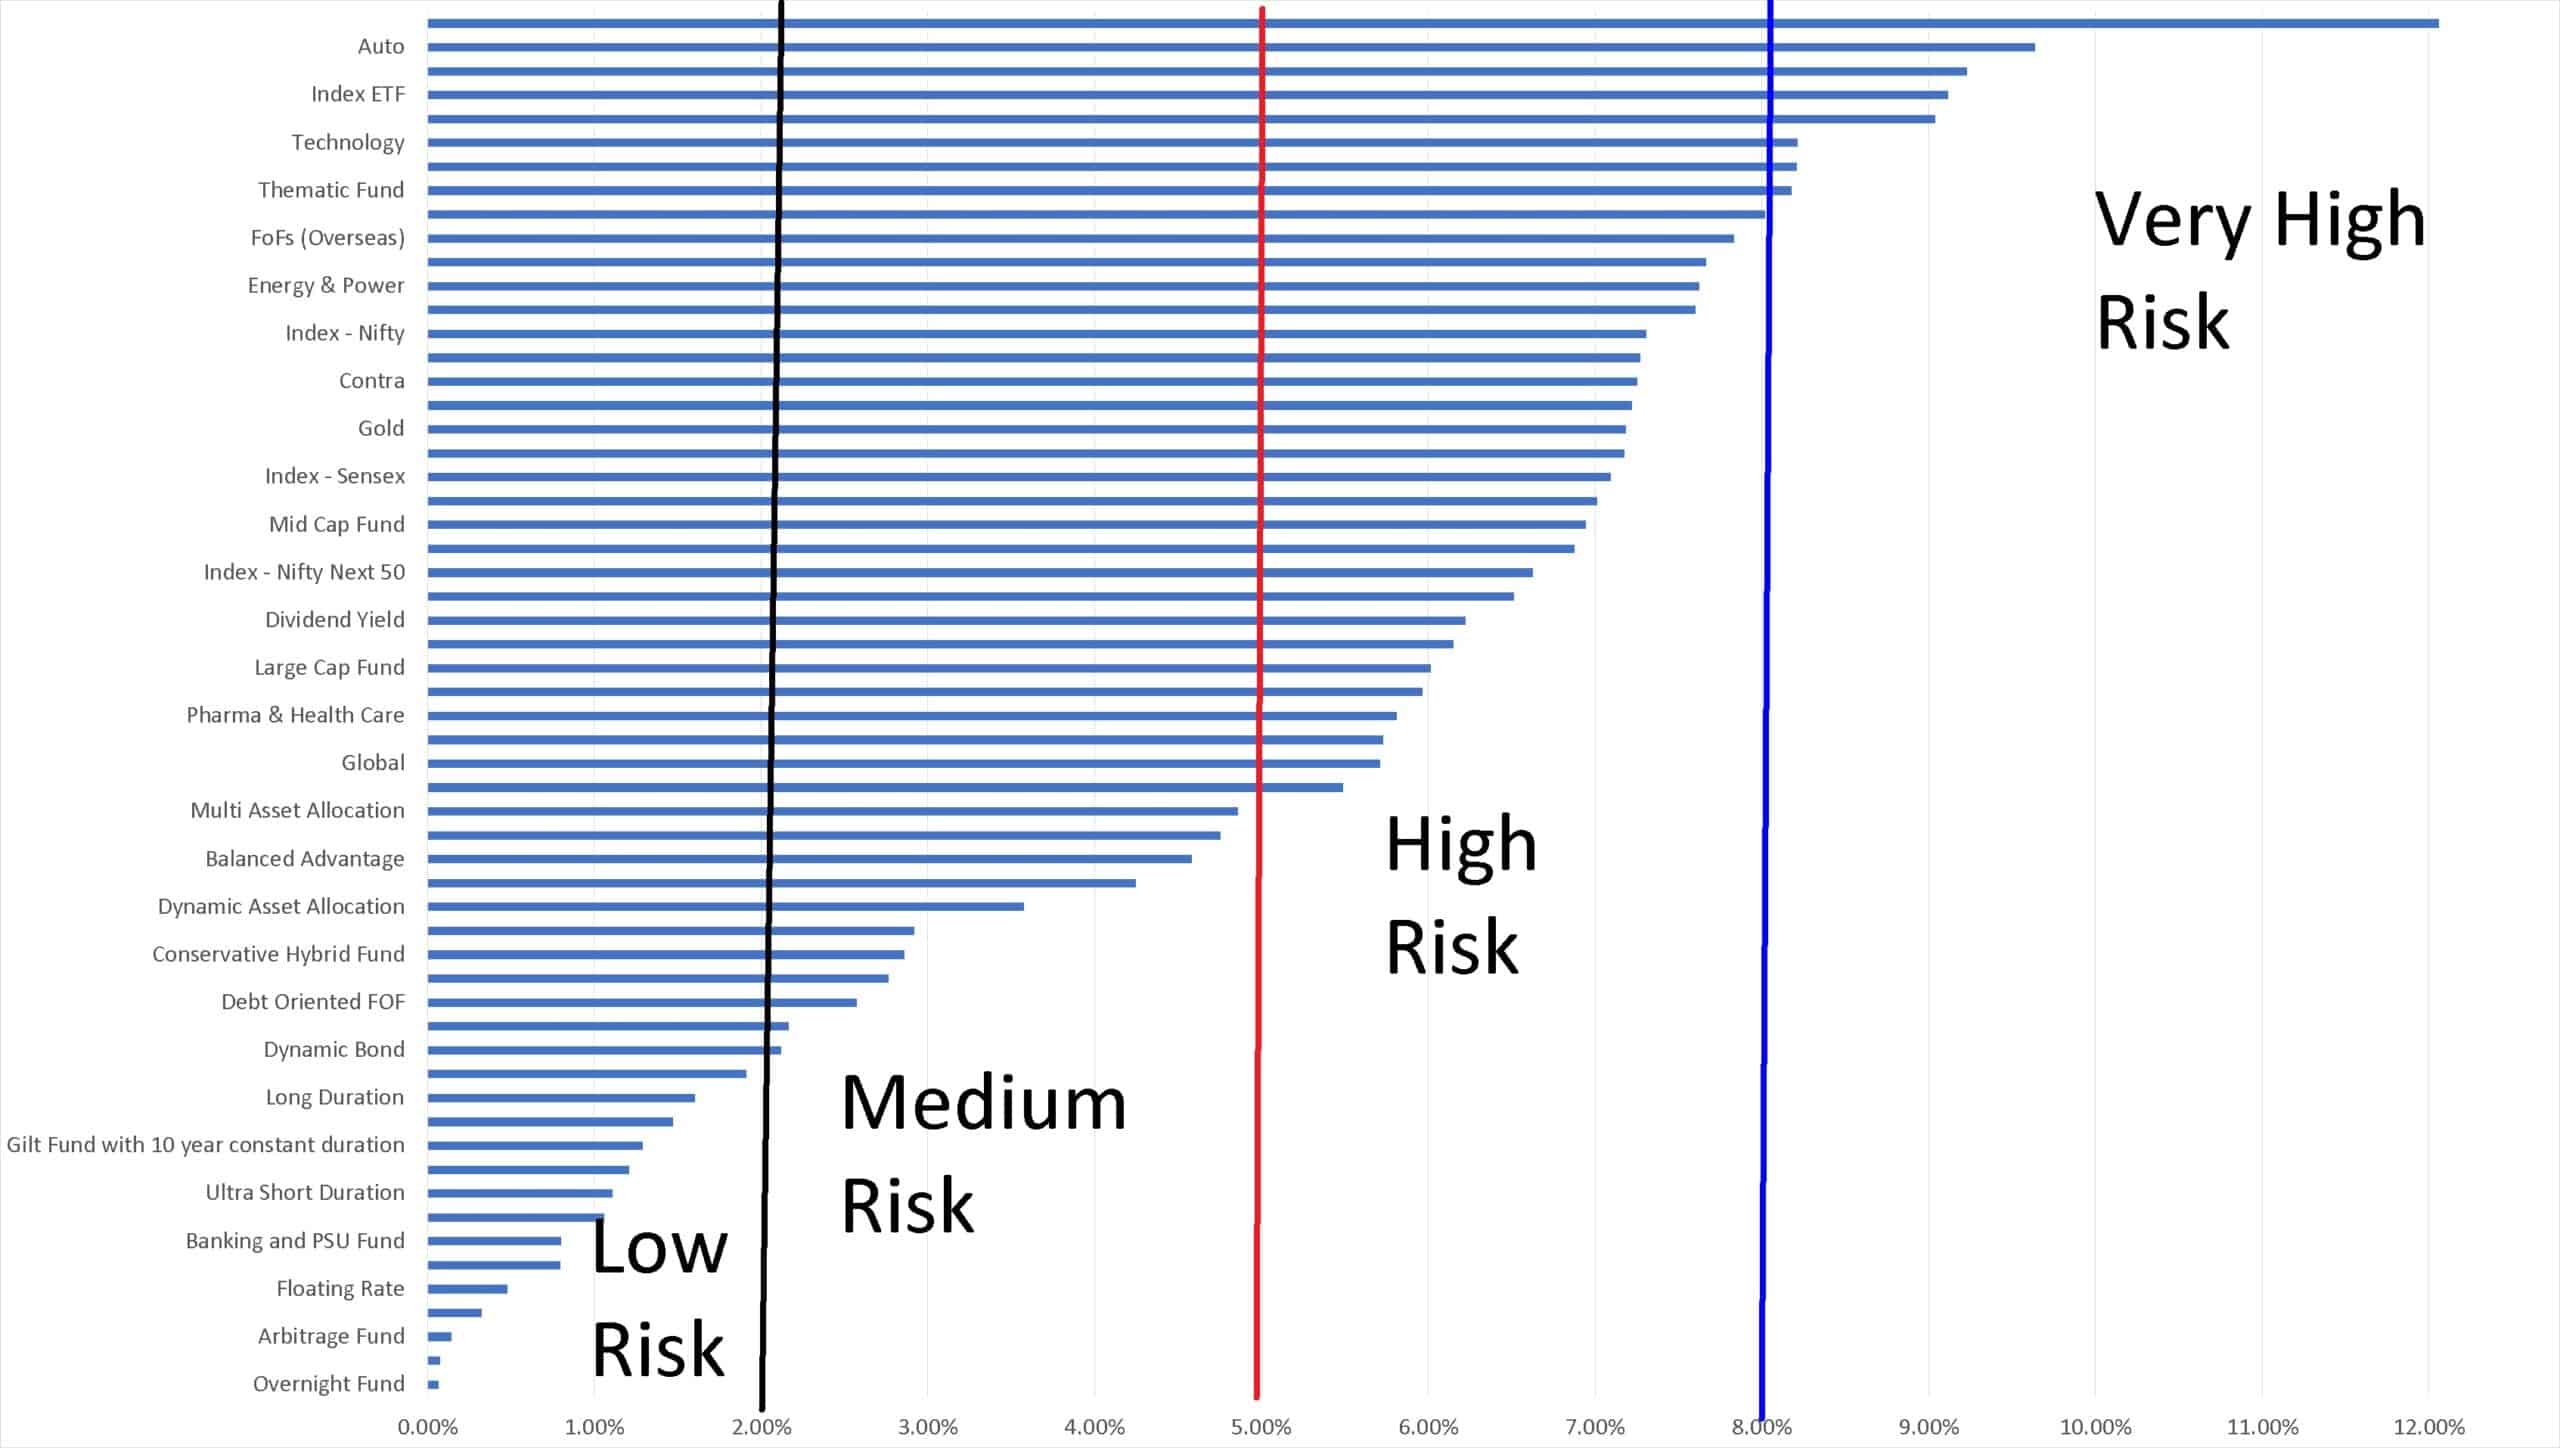
These are the scheme-wise ratings.
| Category | Risk Grade |
| Overnight Fund | Low Risk |
| Liquid | Low Risk |
| Arbitrage Fund | Low Risk |
| Money Market | Low Risk |
| Floating Rate | Low Risk |
| Corporate Bond | Low Risk |
| Banking and PSU Fund | Low Risk |
| Short & Mid Term | Low Risk |
| Ultra Short Duration | Low Risk |
| Debt ETF | Low Risk |
| Gilt Fund with 10 year constant duration | Low Risk |
| Medium to Long Duration | Low Risk |
| Long Duration | Low Risk |
| Low Duration | Low Risk |
| Dynamic Bond | Medium Risk |
| Short Duration | Medium Risk |
| Debt Oriented FOF | Medium Risk |
| Medium Duration | Medium Risk |
| Conservative Hybrid Fund | Medium Risk |
| Equity Savings | Medium Risk |
| Dynamic Asset Allocation | Medium Risk |
| Solution Oriented – Retirement Fund | Medium Risk |
| Balanced Advantage | Medium Risk |
| Solution Oriented – Children’s Fund | Medium Risk |
| Multi Asset Allocation | Medium Risk |
| MNC | High Risk |
| Global | High Risk |
| Aggressive Hybrid Fund | High Risk |
| Pharma & Health Care | High Risk |
| Consumption | High Risk |
| Large Cap Fund | High Risk |
| Equity Oriented | High Risk |
| Dividend Yield | High Risk |
| Index Funds – Other | High Risk |
| Index – Nifty Next 50 | High Risk |
| Flexi Cap Fund | High Risk |
| Mid Cap Fund | High Risk |
| Equity Linked Savings Scheme | High Risk |
| Index – Sensex | High Risk |
| Focused Fund | High Risk |
| Gold | High Risk |
| Service Industry | High Risk |
| Contra | High Risk |
| Large & Mid Cap | High Risk |
| Index – Nifty | High Risk |
| ETFs – Other | High Risk |
| Energy & Power | High Risk |
| Multi Cap Fund | High Risk |
| FoFs (Overseas) | High Risk |
| Infrastructure | High Risk |
| Thematic Fund | Very High Risk |
| Small cap Fund | Very High Risk |
| Technology | Very High Risk |
| Value Fund | Very High Risk |
| Index ETF | Very High Risk |
| Banks & Financial Services | Very High Risk |
| Auto | Very High Risk |
| Credit Risk Fund | Very High Risk |
This classification is far from perfect but does a reasonable job of conveying absolute and relative volatility levels. The classification is also not permanent. The categories may move up and down depending on the 3Y window considered.
It is amusing to see that a credit risk fund has the highest avg standard deviation possibly due to multiple defaults.
As mentioned above, the latent risks, that is for example when a credit default does not occur, cannot be captured by using standard deviation. The individual scheme rating profile (portfolio weights for each rating allocation) is necessary for this. We recommend using our monthly debt mutual fund screener for such data.
Appendix
This is the table of scheme categories and avg of min and max standard deviations used.
| Category | Avg |
| Overnight Fund | 0.0656% |
| Liquid | 0.0770% |
| Arbitrage Fund | 0.1451% |
| Money Market | 0.3230% |
| Floating Rate | 0.4772% |
| Corporate Bond | 0.7949% |
| Banking and PSU Fund | 0.8022% |
| Short & Mid Term | 1.0574% |
| Ultra Short Duration | 1.1091% |
| Debt ETF | 1.2071% |
| Gilt Fund with 10 year constant duration | 1.2898% |
| Medium to Long Duration | 1.4706% |
| Long Duration | 1.6028% |
| Low Duration | 1.9123% |
| Dynamic Bond | 2.1201% |
| Short Duration | 2.1639% |
| Debt Oriented FOF | 2.5739% |
| Medium Duration | 2.7628% |
| Conservative Hybrid Fund | 2.8615% |
| Equity Savings | 2.9166% |
| Dynamic Asset Allocation | 3.5758% |
| Solution Oriented – Retirement Fund | 4.2455% |
| Balanced Advantage | 4.5830% |
| Solution Oriented – Children’s Fund | 4.7552% |
| Multi Asset Allocation | 4.8606% |
| MNC | 5.4908% |
| Global | 5.7120% |
| Aggressive Hybrid Fund | 5.7278% |
| Pharma & Health Care | 5.8094% |
| Consumption | 5.9672% |
| Large Cap Fund | 6.0169% |
| Equity Oriented | 6.1502% |
| Dividend Yield | 6.2219% |
| Index Funds – Other | 6.5155% |
| Index – Nifty Next 50 | 6.6253% |
| Flexi Cap Fund | 6.8748% |
| Mid Cap Fund | 6.9440% |
| Equity Linked Savings Scheme | 7.0114% |
| Index – Sensex | 7.0936% |
| Focused Fund | 7.1771% |
| Gold | 7.1866% |
| Service Industry | 7.2213% |
| Contra | 7.2514% |
| Large & Mid Cap | 7.2697% |
| Index – Nifty | 7.3067% |
| ETFs – Other | 7.6026% |
| Energy & Power | 7.6231% |
| Multi Cap Fund | 7.6637% |
| FoFs (Overseas) | 7.8338% |
| Infrastructure | 8.0191% |
| Thematic Fund | 8.1773% |
| Small cap Fund | 8.2091% |
| Technology | 8.2134% |
| Value Fund | 9.0379% |
| Index ETF | 9.1176% |
| Banks & Financial Services | 9.2307% |
| Auto | 9.6362% |
| Credit Risk Fund | 12.0610% |