Last Updated on December 29, 2021 at 5:34 pm
In the last year (as on 29th May), two gilts ETFs returned 13% and all direct plan gilt funds moved up between 10% to 17%. Is this then a good time to buy gilt mutual funds?
Perhaps regular freefincal readers may well know what to do, but this article is directed at newer readers, young and old. Looking at returns in the recent past and investing based on that is probably the biggest mistake one can make.
This happens with gold (unless you have a momentum strategy in place), stocks and also gilt mutual funds, pretty much all asset classes. Why are gilt funds giving so high return?
🔥Secure your future with our Robo-advisory tool trusted by over 3,500 investors and advisors. From effortless retirement planning to funding your children’s biggest dreams, turn your financial goals into reality. 🔥
Subscribe for money management solutions via email! (Link takes you to our email sign-up form) Join 32,000+ readers in our community.
👉 New Tool Alert! NaviPlan: A Privacy-Focused Multi-asset Tracker and Goal Planner 👈
The RBI repo rate – the overnight rate used to regulate the economy – has called from 6.5% in Aug 2018 to 4% in May 2020. This decreases slowly propagates to longer duration govt bonds.
This means gilt bonds already in circulation have a higher interest rate than the ones newly issued and therefore more valuable. This increases their price and the price of the mutual funds that hold them. This is a temporary phenomenon and is unlikely to last.
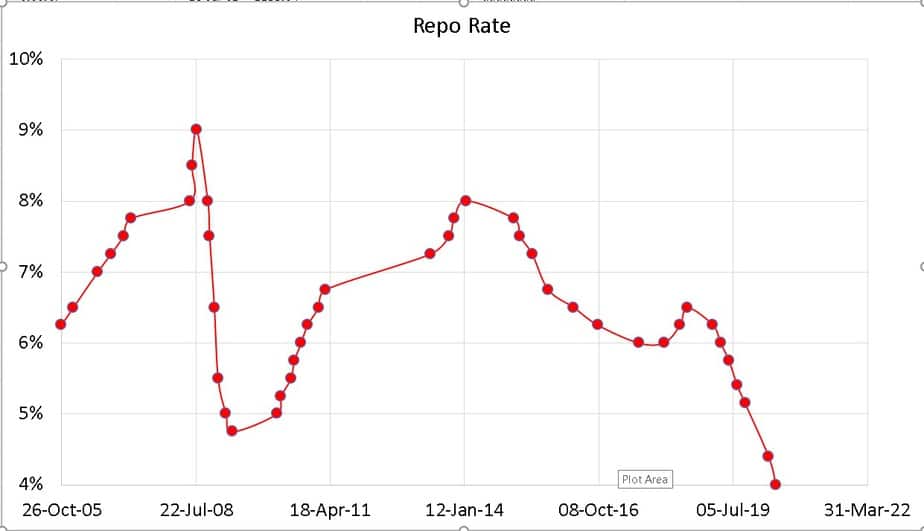
During the early 2000s, India came out of its decade long bankruptcy crisis and double-digit PPF interest rates came crashing down. During this period – 2000, 01,02 and 03 – Birla G-sec fund had these incredible annual returns:
| 2000 | 10.5 |
| 2001 | 25.2 |
| 2002 | 19.7 |
| 2003 | 12.2 |
Anyone who looked at these and thought, “why to invest in the stock market when gilt funds give this much returns!” would have to face these returns from the fund.
| 2004 | -1.96 |
| 2005 | 5.6 |
| 2006 | 5.3 |
| 2007 | 6.7 |
Remember the Indian stock market traded flat in the 90s and zoomed up in the 2000s while fixed deposits rates were still 8%-ish. This is the problem with chasing recent past performance.
Then came the 2008 crash, the sharp fall in interest rates (9% to 4.7%, the market recover and the shart increase in int rates (back to 6.8%) and this is how fund moved.
| 2008 | 20.3 |
| 2009 | -10.5 |
Since then we saw a high-inflation regime up to 2014 and a gradual fall in rates since then, briefly interrupted only in 2018 when rates moved up a bit, the fund returns have varied this way:
| 2010 | 2.5 |
| 2011 | 9.8 |
| 2012 | 11.4 |
| 2013 | 3.5 |
| 2014 | 19.9381 |
| 2015 | 5.7 |
| 2016 | 16.7 |
| 2017 | 4.5 |
| 2018 | 6.9 |
| 2019 | 10.9 |
Can you handle these up and down movements? If no, then stay away from gilts. Tactical buying and selling of gilt funds may be possible but not for those who wish to invest after looking at last 1Y returns.
Of course, gilt funds can be used as part of a long-term portfolio with systematic rebalancing. Then again last 1Y returns do not matter.
How to find out if a mutual fund is too risky for me?
Look for the worst and best performing fund. You can get this at portals like Value Research.
| Best (Period) | Worst (Period) | |
|---|---|---|
| Week | 7.28 (11-Dec-2008 – 18-Dec-2008) | -10.03 (02-Jan-2009 – 09-Jan-2009) |
| Month | 17.24 (18-Nov-2008 – 18-Dec-2008) | -9.84 (02-Jan-2009 – 03-Feb-2009) |
| Quarter | 23.74 (03-Oct-2008 – 02-Jan-2009) | -13.38 (05-Jan-2009 – 06-Apr-2009) |
| Year | 27.39 (04-Dec-2000 – 04-Dec-2001) | -12.18 (02-Jan-2009 – 04-Jan-2010) |
Observe the worse returns. Can you handle that emotionally? Look at the variations between the best and worst returns. The more the variation, the riskier the fund. Never chase recent past good performance without a plan. More often than not, it won’t end well.