Mutual fund NAV risk is measured using the standard deviation. This can be thought of as the average deviation of a monthly return from the average monthly return. Higher the value, the higher the risk. Unfortunately, this is not an intuitive number like the return. So this begs the question, is it possible to classify mutual fund risk using their returns?
Let us consider L&T Overnight Fund. Over the last 3Y (as of 6th June 2022) its annualized return is 3.435% (this is the CAGR). Over this 3Y period, the average monthly return is 0.282%.
Now we annualize this monthly return: = (1+0.282%)^12-1 = 3.437%. Notice that there is practically no difference between the CAGR and the annualized monthly return. Ideally, in the case of a fixed-income instrument with no market volatility, the CAGR and the annualized monthly return will be identical.
As the market volatility increases, the difference between the two quantities also increases. This is a direct return-based volatility measure.
Now consider IDBI Hybrid Equity Fund.
🔥Secure your future with our Robo-advisory tool trusted by over 3,500 investors and advisors. From effortless retirement planning to funding your children’s biggest dreams, turn your financial goals into reality. 🔥
Subscribe for money management solutions via email! (Link takes you to our email sign-up form) Join 32,000+ readers in our community.
👉 New Tool Alert! NaviPlan: A Privacy-Focused Multi-asset Tracker and Goal Planner 👈
- 3Y CAGR: 9.339%
- Annualised monthly returns: 10.863%.
- Difference: 1.52%. Notice the significant increase in the difference.
This difference is a return-based measure of mutual fund volatility. This data is readily available in mutual fund rating portals. For example, on any Value Research fund page, the 3Y return is available in the “Peer Comparison” comparison table. The annualized average monthly return is available in the “Risk Measures (%)” table.
The graph below shows the difference between annualised average monthly return and 3Y annualized return (y-axis) vs Standard deviation (x-axis) for 874 mutual funds.
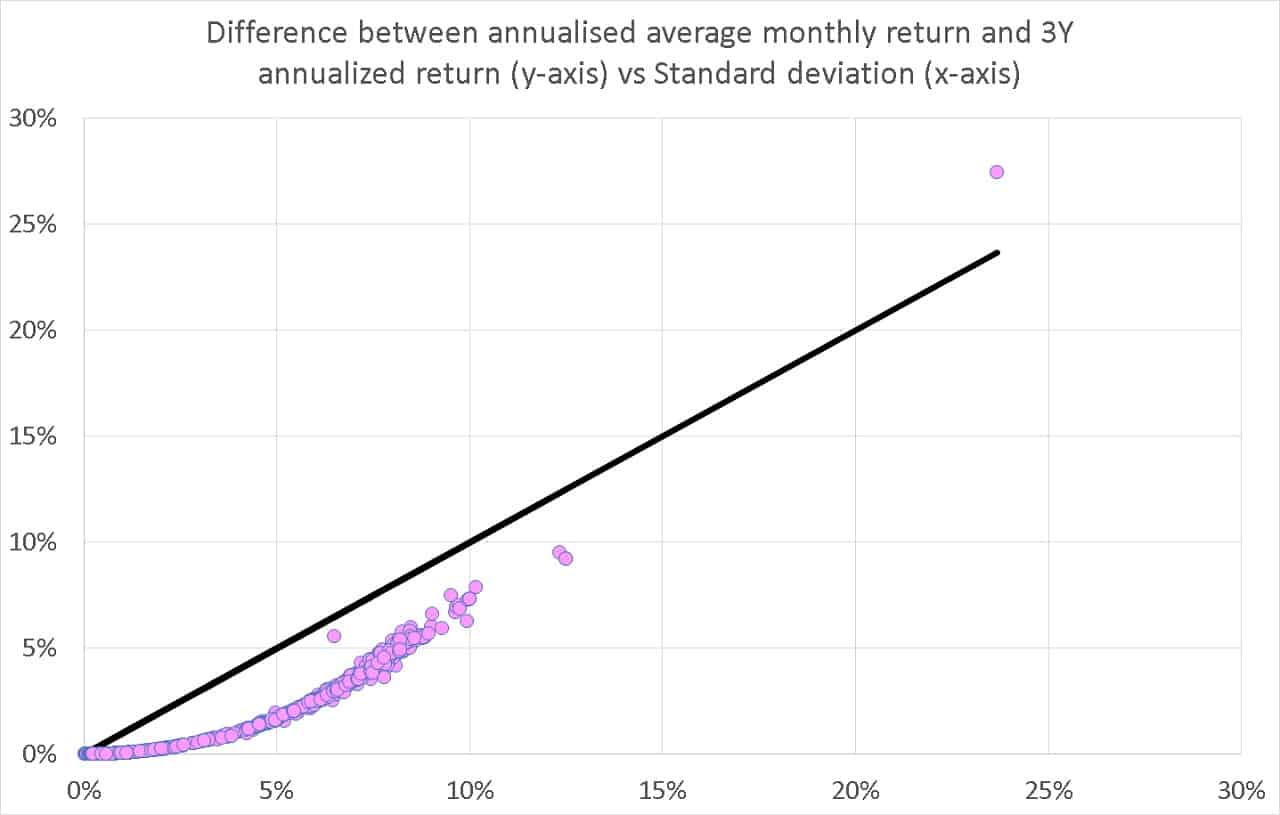
The straight line is the standard deviation reference line. The return difference is rather subdued than the standard deviation for low values and quickly picks up. This means that the return difference is not a good measure to differentiate a money market fund from an overnight fund. It will work better when comparing an equity fund with a debt fund.
For a detailed classification of risk based on standard deviation see: How can I tell if a mutual fund is less/more risky than other funds?
It must be understood that both the standard deviation and return difference are measures of volatility. They are not indicators of the underlying cause of the volatility! They cannot measure the latent risk that does not manifest in the fund’s NAV. In other words, volatility is realised risk. There are many other unrealised factors which cannot be quantified via the NAV. See: Basics: What is the difference between risk and volatility?
A risk scale based on annualised monthly return minus CAGR
- Get the 3Y CAGR and annualised monthly returns of 874 funds over the last 3Y across 58 scheme classifications (some thematic funds are individually classified, hence the large number).
- Compute, return difference = annualized monthly return minus 3Y CAGR
- Find the min and max return difference of each category
- Find the simple average of this min and max.
- So now we have a table of categories and avg. return differences
- Find the average (m) and standard deviation (s) of the above set
- Funds that lie above m+s we classify as very high risk
- Funds that lie between m and m+s we classify as high risk
- Funds that lie between m-s and m we classify as medium risk
- Funds that lie below m-s we classify as low risk
This is a pictorial representation of the classification. As mentioned above, the low-risk classification is not accurate. Some of the category placements are non-intuitive.
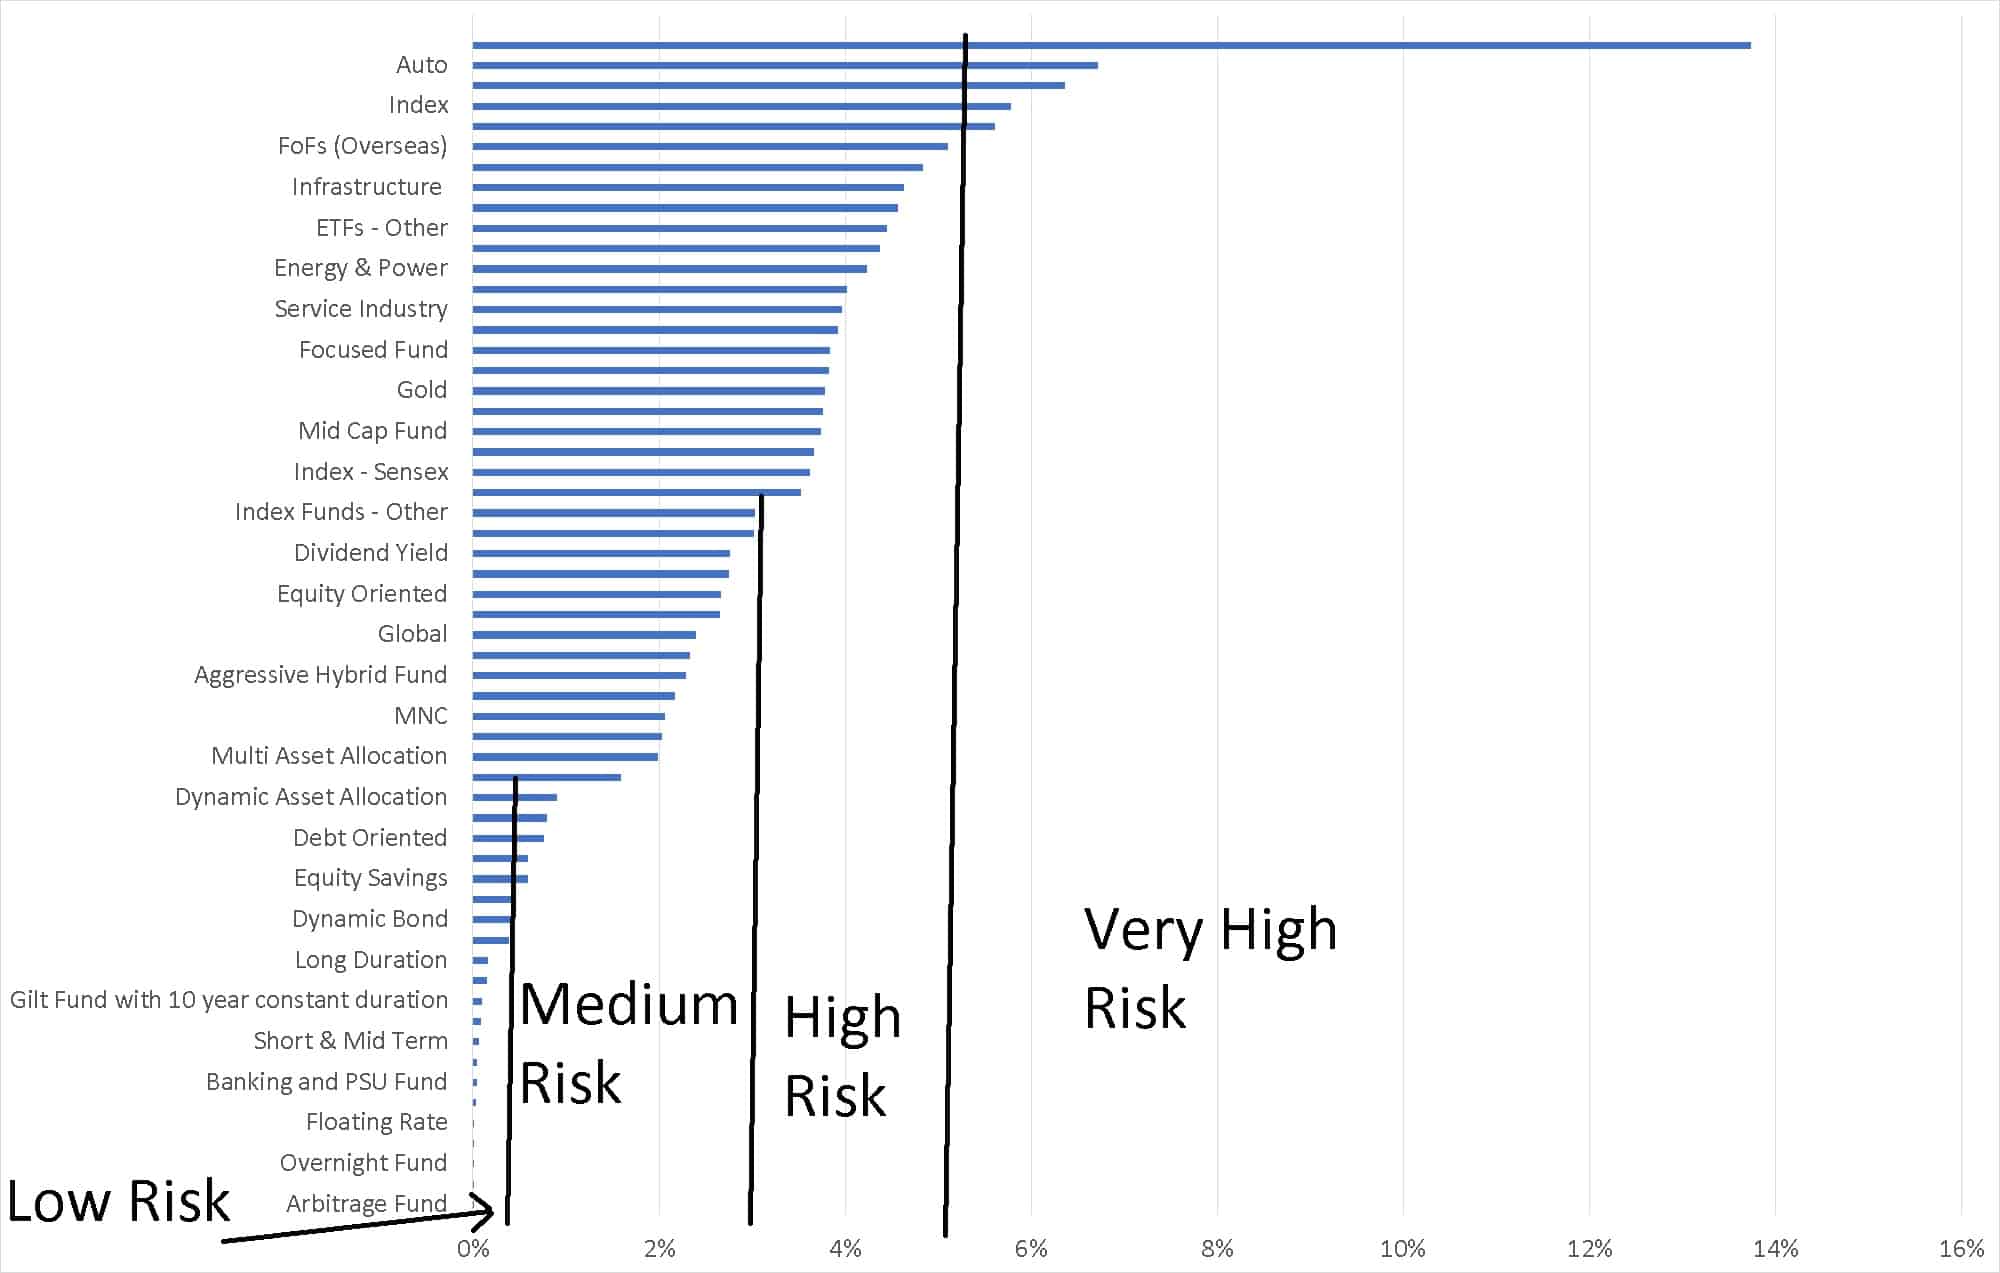
These are the scheme-wise ratings.
| Category | Rating based on return difference |
| Arbitrage Fund | low risk |
| Liquid | low risk |
| Overnight Fund | low risk |
| Money Market | low risk |
| Floating Rate | low risk |
| Ultra Short Duration | low risk |
| Banking and PSU Fund | low risk |
| Corporate Bond | low risk |
| Short & Mid Term | low risk |
| Debt | low risk |
| Gilt Fund with a 10-year constant duration | low risk |
| Medium to Long Duration | low risk |
| Long Duration | low risk |
| Low Duration | medium risk |
| Dynamic Bond | medium risk |
| Short Duration | medium risk |
| Equity Savings | medium risk |
| Conservative Hybrid Fund | medium risk |
| Debt Oriented | medium risk |
| Medium Duration | medium risk |
| Dynamic Asset Allocation | medium risk |
| Balanced Advantage | medium risk |
| Multi Asset Allocation | medium risk |
| Solution Oriented – Children’s Fund | medium risk |
| MNC | medium risk |
| Solution Oriented – Retirement Fund | medium risk |
| Aggressive Hybrid Fund | medium risk |
| Pharma & Health Care | medium risk |
| Global | medium risk |
| Consumption | High Risk |
| Equity Oriented | High Risk |
| Large Cap Fund | High Risk |
| Dividend Yield | High Risk |
| Index – Nifty Next 50 | High Risk |
| Index Funds – Other | High Risk |
| Flexi Cap Fund | High Risk |
| Index – Sensex | High Risk |
| Thematic Fund | High Risk |
| Mid Cap Fund | High Risk |
| Equity Linked Savings Scheme | High Risk |
| Gold | High Risk |
| Index – Nifty | High Risk |
| Focused Fund | High Risk |
| Contra | High Risk |
| Service Industry | High Risk |
| Large & Mid Cap | High Risk |
| Energy & Power | High Risk |
| Multi Cap Fund | High Risk |
| ETFs – Other | High Risk |
| Technology | High Risk |
| Infrastructure | High Risk |
| Value Fund | High Risk |
| FoFs (Overseas) | Very High Risk |
| Small cap Fund | Very High Risk |
| Index | Very High Risk |
| Banks & Financial Services | Very High Risk |
| Auto | Very High Risk |
| Credit Risk Fund | Very High Risk |
In summary, while in principle mutual fund volatility can be measured in terms of “annualized monthly return minus CAGR” it is not as sensitive as the standard deviation for short-term debt mutual funds. It can however be used as a crude measure by investors to appreciate how volatile an equity fund or a hybrid fund is.