Last Updated on September 8, 2024 at 12:44 pm
A reader insisted that gold is a “safe ” instrument and should be considered part of a portfolio’s fixed income or debt. Nothing could be further than the truth: Gold is as risky as equity and not a debt instrument! Here is some supporting data.
Let us start with the standard deviation of gold, equity* and 10Y gilts over the last 1,2,3,4,5,6,7,8,9,10 and 11** years. The standard deviation measures how much daily returns (in this case) deviate from the average daily return over the period considered. The larger the value, the larger the volatility in price.
* Nifty 50 is assumed to represent “equity”. The inclusion of mid and small cap segments will only make equity a bit more volatile but does not change the central conclusions of this article
** This is an arbitrary choice. Technically, these results are only valid for the period considered but generally represent typical asset class behaviour. See: Charts: Equity vs. Gold. Vs. Debt. Also see: Gold is riskier than Stocks!
🔥Secure your future with our Robo-advisory tool trusted by over 3,500 investors and advisors. From effortless retirement planning to funding your children’s biggest dreams, turn your financial goals into reality. 🔥
Subscribe for money management solutions via email! (Link takes you to our email sign-up form) Join 32,000+ readers in our community.
👉 New Tool Alert! NaviPlan: A Privacy-Focused Multi-asset Tracker and Goal Planner 👈
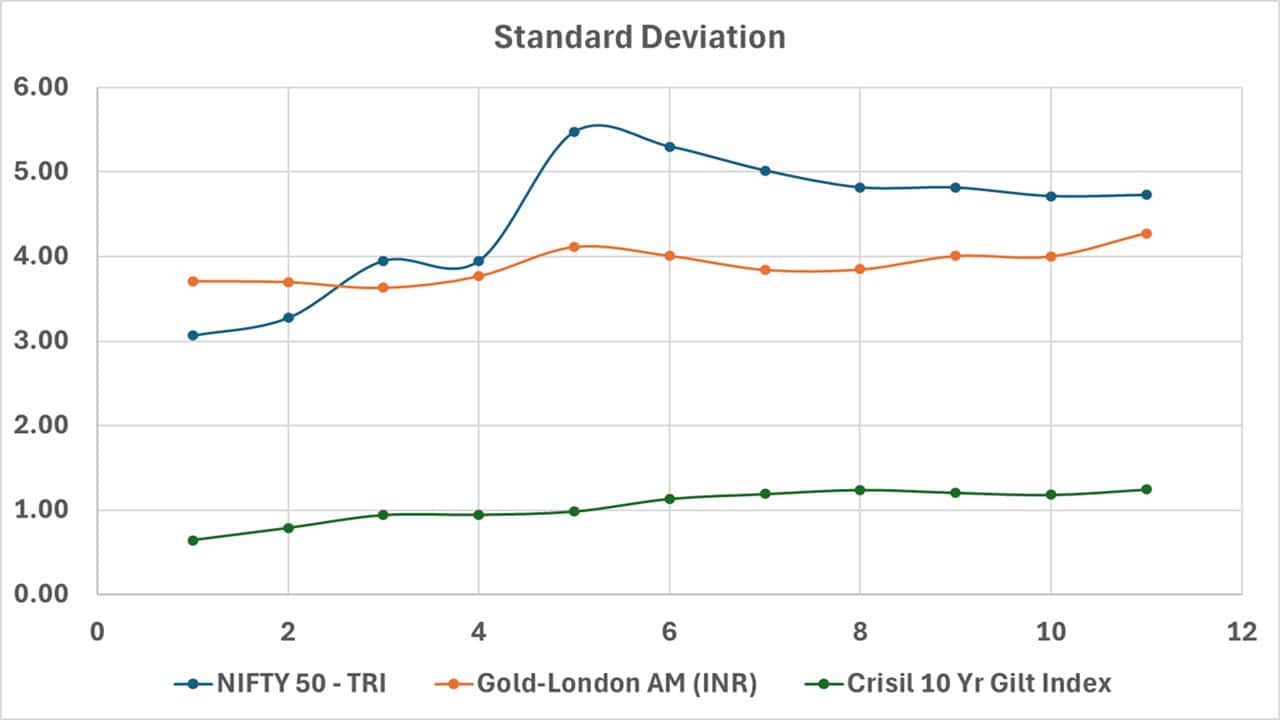
Notice how gold and equity have similar volatilities well above that of debt. This proves that gold is as risky as equity and not a debt instrument!
There is more than one way to define risk. Now let us consider the maximum fall over the last 11 years and how long the indices stayed “underwater” (below a previous maximum). The maximum gain and its corresponding period are also shown (an asset class that loses big also tends to gain big).
Gold-London AM (INR)
- Maximum Drawdown Start 28-Aug-13
- Maximum Drawdown End 31-Jul-15
- Maximum Gain 106.7476 (12-Aug-2013 To 02-Aug-2024)
- Maximum Drawdown -32.3294
NIFTY 50 – TRI
- Maximum Drawdown Start 14-Jan-20
- Maximum Drawdown End 23-Mar-20
- Maximum Gain 178.4847 (12-Aug-2013 To 09-Aug-2024)
- Maximum Drawdown -45.8201
Crisil 10 Yr Gilt Index
- Maximum Drawdown Start 03-Sep-17
- Maximum Drawdown End 22-Feb-18
- Maximum Gain 72.1776 (12-Aug-2013 To 09-Aug-2024)
- Maximum Drawdown -6.5275
The drawdown for gold and equity are comparable, while that of gilts is much lower.
A standard deviation considers both positive and negative deviations from the average. Some analysts like to consider “downside risk”. That is, only the negative deviation alone. I am not a big fan of this, as the positive and negative deviations are joined at the hip.
For what it is worth, the downside risk of gold, equity and 10Y gilts over the last 1,2,3,4,5,6,7,8,9,10 and 11 years is shown below.
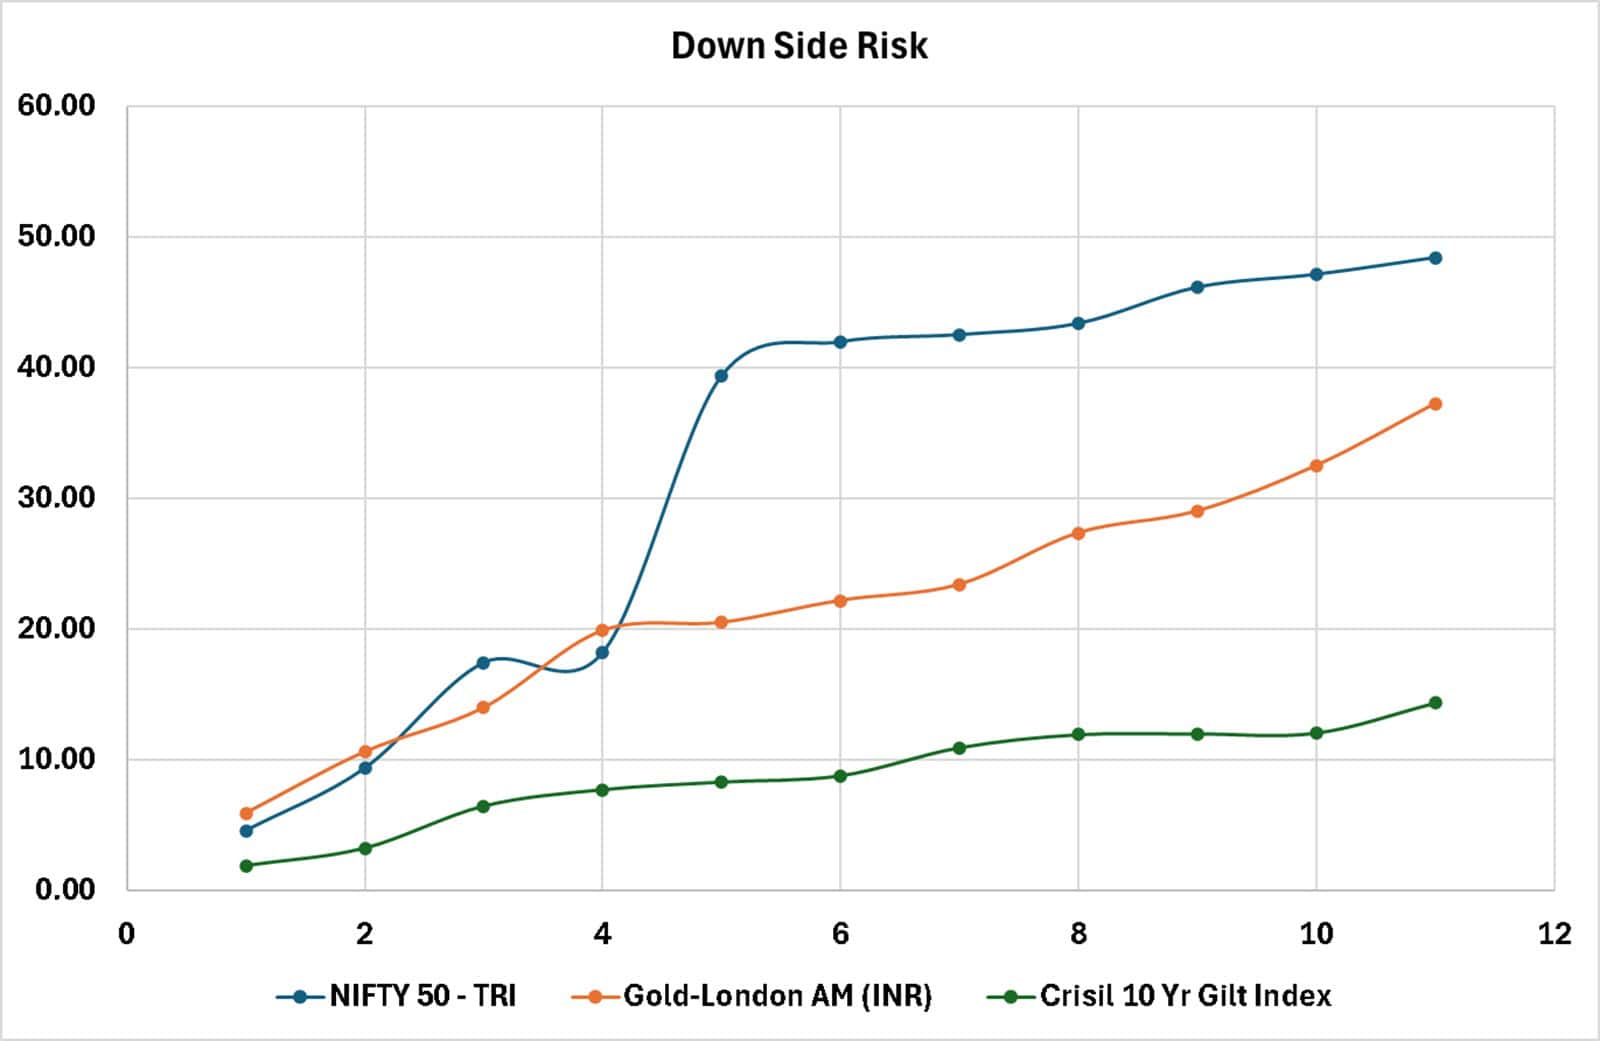
Again, equity and gold have comparable downside risks, while gilts are a cut lower.
One can also define a downside probability: = Total number of negative returns in a period/ Total number of returns in a period.
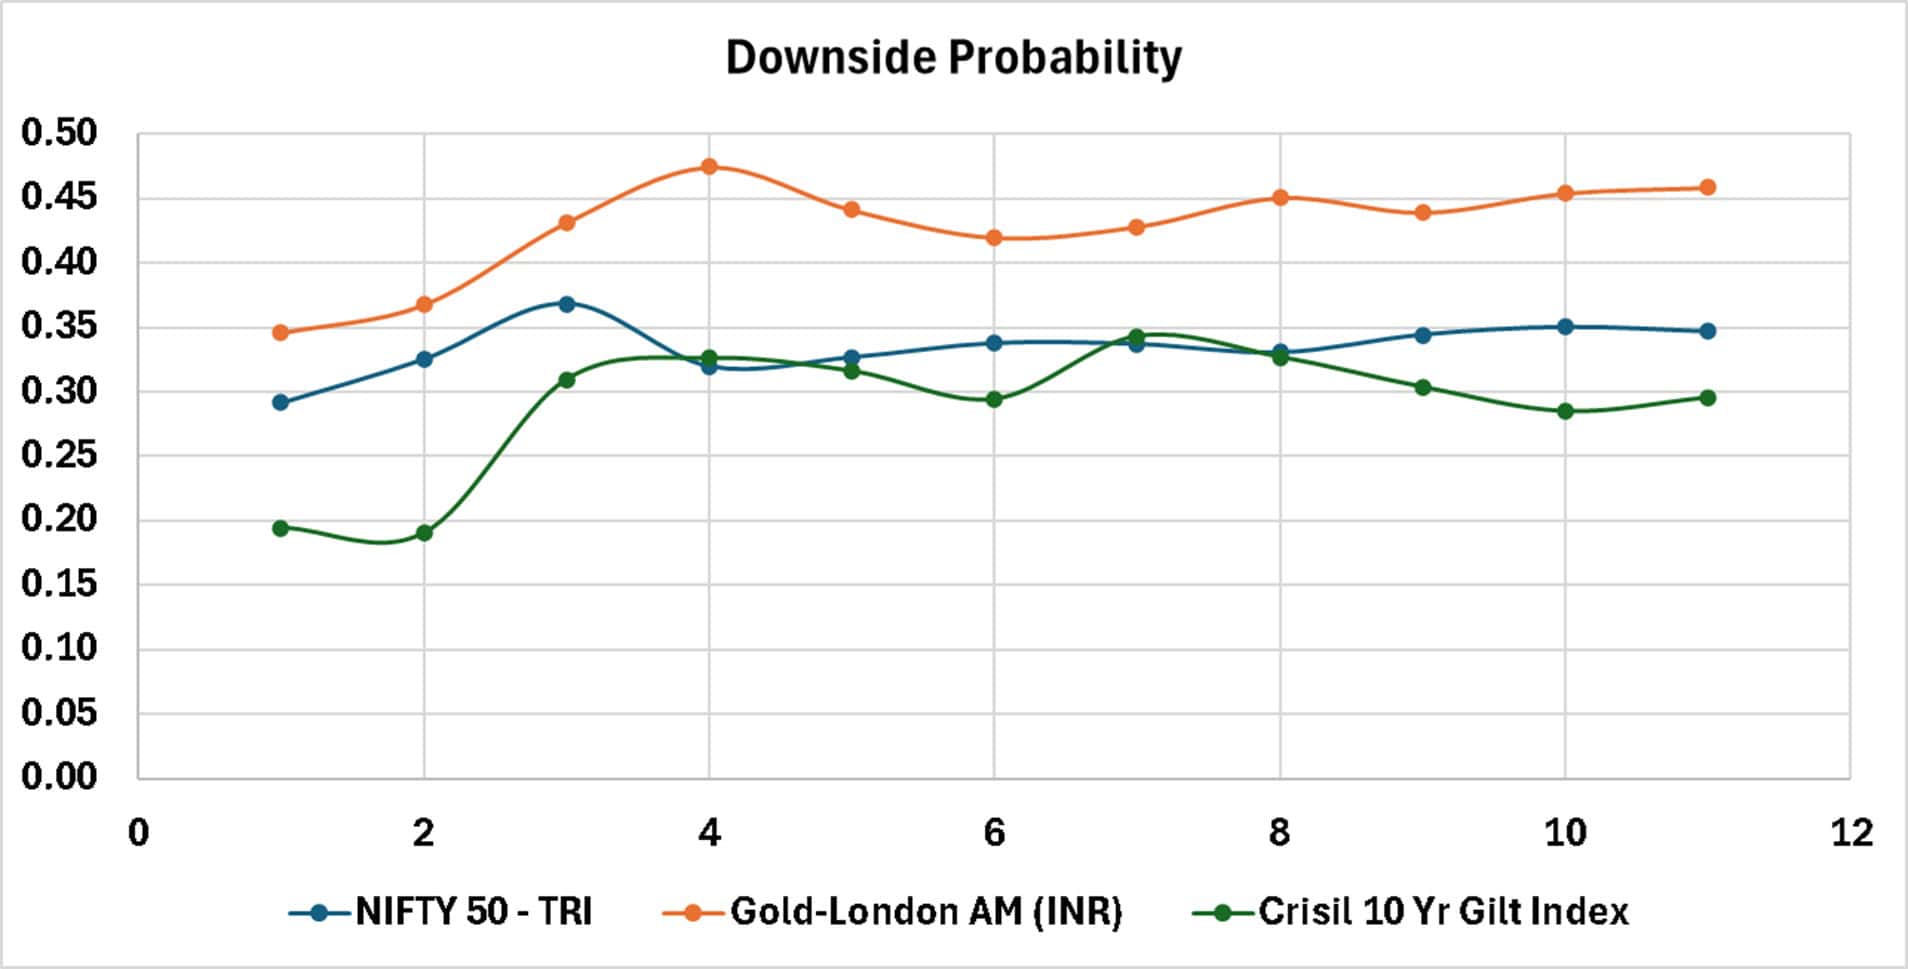
Amusingly, gold has more negative returns (in the periods considered), while equity and gilts are comparable.
In summary, do not assume gold is a “safe” instrument. It is a separate asset class that is at least as risky/volatile as equity (at times more) and is not a fixed income or debt instrument!