This article compares my stock portfolio with an equivalent investment in a Nifty index fund and the Nifty 100 Low Volatility 30 TR index. We post this comparison each month. Before we begin, new readers need to understand the context of these investments.
Update: We recently added a new tool to the freefincal investor circle – Identify stocks with earnings power with this new tool. See results: Earnings power valuation of my portfolio stocks.
I started direct equity investing only after achieving a comfortable level of financial independence and ensuring my son’s future portfolio is reasonably secure. At the time of writing, its value accounts for approximately 8.25% of my equity MF retirement portfolio and 4.88% of my total retirement portfolio.
Therefore, I invested without fear of performance. I don’t experiment or research stock selection. That is often a waste of time and, therefore, a waste of true wealth. I continue to invest in the same way.
Caution: No part of this article should be treated as investment advice. I started investing in stocks after establishing my goal-based investing strategy. Readers should appreciate that I began investing in stocks after achieving financial independence. Therefore, I have no pressure when picking stocks, as mentioned here. Please do your own research and invest accordingly, based on your circumstances.
🔥Secure your future with our Robo-advisory tool trusted by over 3,500 investors and advisors. From effortless retirement planning to funding your children’s biggest dreams, turn your financial goals into reality. 🔥
Subscribe for money management solutions via email! (Link takes you to our email sign-up form) Join 32,000+ readers in our community.
👉 New Tool Alert! NaviPlan: A Privacy-Focused Multi-asset Tracker and Goal Planner 👈
My goal is to buy stocks with practically zero research. I also continue to invest in mutual funds as usual.
I have purchased mutual funds every month, regardless of market levels, and I will strive to replicate this approach with direct equity if I have the money. Additionally, see ‘18 years of mutual fund investing: My Journey and lessons learned‘
Time is not just money; Time is unquantifiable money. Time wasted on stock or mutual fund analysis, on deciding when to invest, etc., is an unquantifiable loss. So, I aim to buy a fund or stock within a minute.
No skills are required for any aspect of my portfolio. I compensate for the lack of knowledge with discipline. Randomness (also known as luck) plays a significant role in the returns (or lack thereof) shown below.
After evaluating the performance of low-volatility indices, I gained confidence in my ability to invest in stocks. I told myself I would not do any stock analysis or research. I would do a quick check of the company’s health and a brief volatility review before deciding to buy. If I cannot buy a stock within a few minutes, I am wasting time and money (in that order).
The stock portfolio is part of my retirement portfolio basket and provides dividends. It could serve as an emergency fund as a last resort. Maybe I will find another use for it in the future.
In FY 2020-21, the total annual dividend income from this portfolio (pre-tax) was approximately 30% of my current monthly expenses. In FY 2021-2022, it increased to about 56%. In FY 2022-23, it rose to about 70%. In FY 2023-2024, the rate was approximately 88%. In FY 2024-2025, the rate was approximately 100%. In FY 2025-206 it became approximately 110%
The next goal is to receive one month’s expenses as a total quarterly dividend (post-tax!). I do not consciously reinvest dividends. Younger people should. It matters little as long as the overall investment made each month continues to grow healthily: How 13 years of tracking investments helped me build wealth.
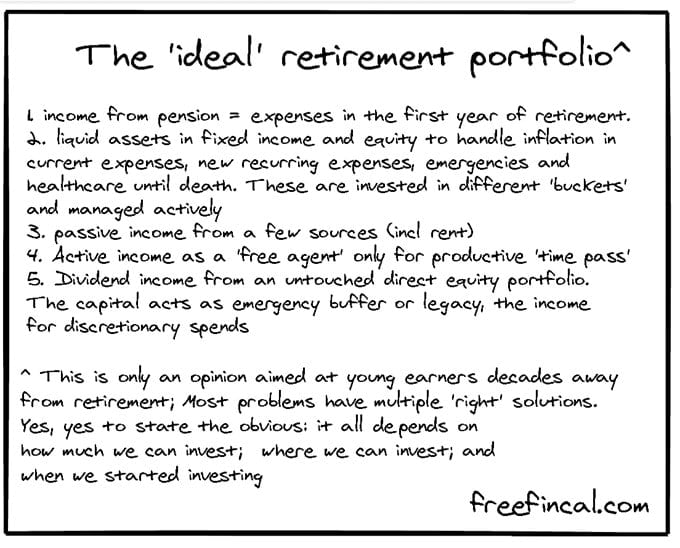
This stock portfolio is part of my overall retirement portfolio. I am striving to build the ideal retirement portfolio. Also, see How to build a second income source that will last a lifetime.
Stock Portfolio Analysis
Update: We recently added a new tool to the freefincal investor circle – Identify stocks with earnings power with this new tool.
See results: Earnings power valuation of my portfolio stocks
This is the portfolio evolution.
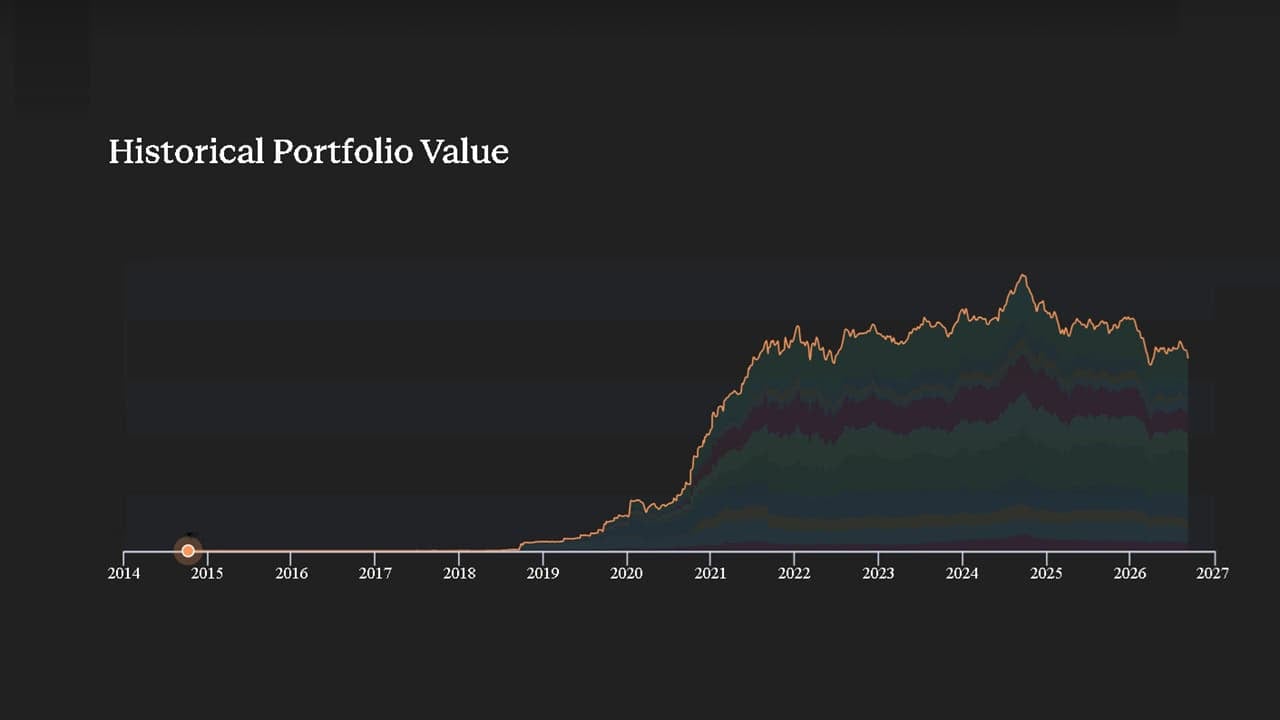
As of Sep 4th 2026, all results are computed using our Google Sheets-based stock and MF portfolio trackers.
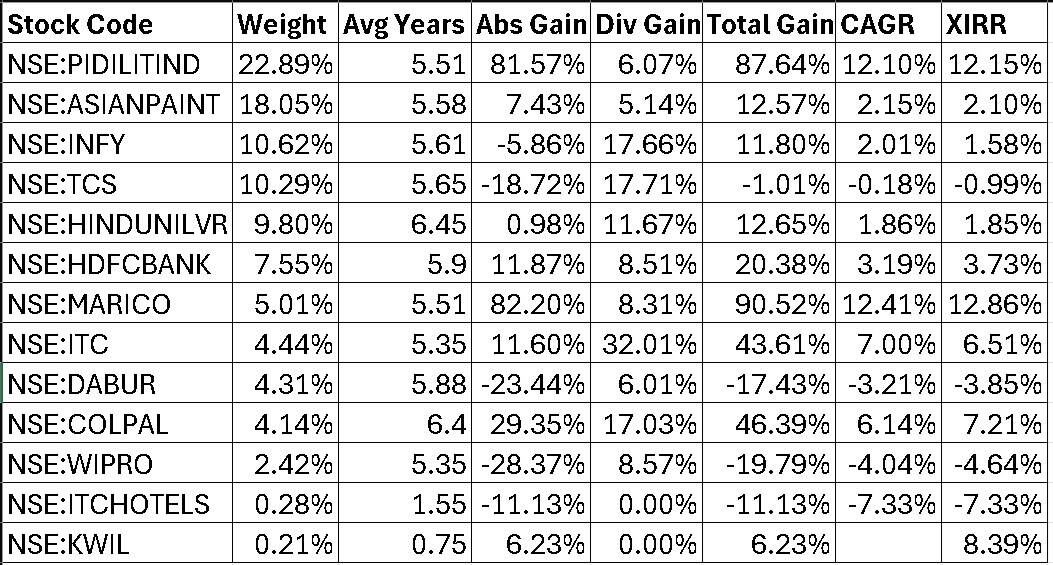
Please note: (1) Although investments started in 2014, most of the money invested is from July 2020. (2) Due to other priorities, I did not invest between November 2021 and April 2022. I did not invest between Oct 2022 and Dec 2025 (last purchase).
The portfolio weights have drifted naturally. When I can invest, I invest in the stocks that have gained the most since I started investing (within the portfolio).
- Dividend Return = Total Dividends divided by Total Investment
- Capital Gain (CG) Returns = Total CG divided by Total Investment
- Total Return = Dividend Return + CG Return.
- CAGR = ( 1 + Total Return ) ^ ( 1 / Avg. Years) – 1
- The average investment duration for the entire portfolio is 5.75 years. This is the average of all purchase investment tenures, weighted by investment amount.
- CAGR is computed only if the average years = > 1. Take XIRR seriously only if the average number of years is >= 1.
- All returns are before tax.
- The portfolio is compared with identical investments in the UTI Nifty 50 Index Fund (direct plan!).
Many people and portals mistakenly treat dividends as cash payouts while calculating XIRR. This is not the universally accepted academic and regulatory convention. Use only the investor’s purchases and redemptions in the XIRR calculation. Treat dividends as reinvested (as mandated by SEBI), and handle other corporate actions accordingly. The freefincal stock tracker aligns with SEBI regulations for all corporate actions (dividends, splits, buybacks, etc.)
Comparison with benchmarks
The Nifty 100 Low Vol 30 is a better benchmark for this portfolio. However, we can only compare it with the index, not the ETF (from ICIC), which was launched only in 2017.
Stock portfolio (absolute return)* 22.24%
UTI Nifty index fund (absolute return)* 76.88%
Nifty Low Vol 30 TRI (absolute return)* 97.11%
Stock portfolio CAGR 3.55%
UTI Nifty Index fund CAGR 10.42%
Nifty Low Vol 30 TRI CAGR 12.52%
Stock Portfolio XIRR (incl all corporate actions like dividends and splits): 3.58%
UTI Nifty Index Fund XIRR 11.60%
Nifty Low Vol 30 TRI XIRR 14.32%
The gain from dividends is 11.28%
* Total return and CAGR include liquidated holdings (see monthly update archives for details).
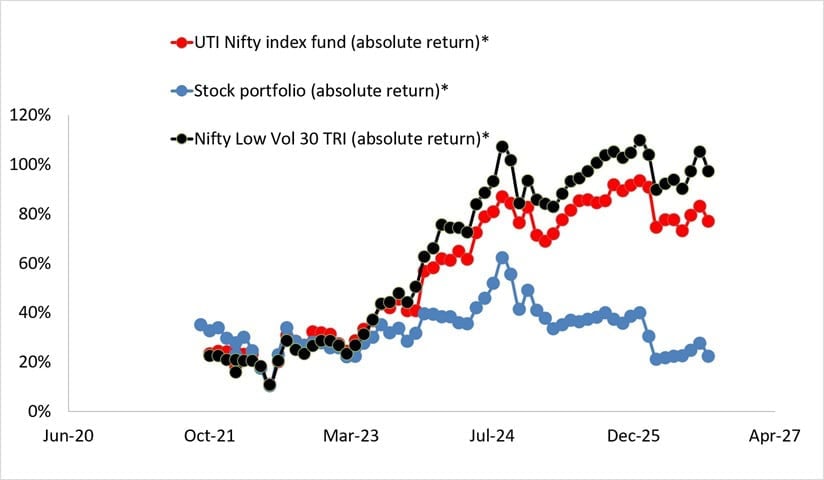
The underperformance does not bother me much because the stock portfolio is a small portion of my retirement corpus, and I treat it as a future source of income. Please do your research and invest.