Last Updated on September 22, 2025 at 10:46 pm
In this article, we consider the tracking errors of Motilal Oswal S&P 500 Index Fund (MO-SP500), Motilal Oswal Nasdaq 100 ETF (MO-N100ETF) and Motilal Oswal Nasdaq 100 Fund of Fund (MO-N100FOF).
In a previous article, we saw that most international equity funds fail to beat the S&P 500 TR (INR). So the issue of tracking error becomes important for the passive funds tracking the S& P 500 and Nasdaq 100.
We shall measure the tracking error simply by the annualised return difference between the fund and its index and not by the standard deviation of monthly return differences between fund and index over a given period. The annualised return difference is a simple way to appreciate tracking errors.
Tracking error of Motilal Oswal S&P 500 Index Fund
Update: Senthil on Twitter pointed out the withholding tax on dividends for these funds which can cause a tracking error. The AMC should then be using an appropriate net dividend tax index to benchmark the fund.
🔥Secure your future with our Robo-advisory tool trusted by over 3,500 investors and advisors. From effortless retirement planning to funding your children’s biggest dreams, turn your financial goals into reality. 🔥
Subscribe for money management solutions via email! (Link takes you to our email sign-up form) Join 32,000+ readers in our community.
👉 New Tool Alert! NaviPlan: A Privacy-Focused Multi-asset Tracker and Goal Planner 👈
In the one year period ending 23rd July 2021, the S&P 500 Total Return in INR index moved up by 37.82% and the net return index (after accounting for tax) moved up by 37.18%. MO-SP500 only moved by up only by 32.5%. The return difference is about 9.5 times more than the direct plan expense ratio of 0.49%.
Is this because of directly trying to track 500 US stocks? The NASDAQ 100 (N100) Total Return in INR moved up by 43.2% for the same period. MO-N100ETF NAV moved up by 37.2% and ETF price by 37.1%. This is a bigger deviation! MO-N100FOF moved up by 35.9%.
Such a large deviation from the index has cost MO-SP500 dearly. Only 3 out of 19 actively managed international mutual funds (directly or via an underlying fund) managed to be the S&P 500 index (study linked above), but 12 out 19 managed to beat the MO-SP500 fund. This does not make actively managed international funds more attractive. They are plagued with their own set of problems, as mentioned before in the same study.
One year is too short a time period to judge. Still, one cannot help but already wonder if Motilal Oswal’s decision to directly track the S&P 500 (or Nasdaq 100) instead of using a US-based ETF or index fund with low tracking error as an underlying fund is right or not. Only time will tell.
As astutely by Pranav Merchant, the performance of MO-N100FOF must be closely compared with that of Kotak Nasdaq 100 FOF. This has a lower TER and invests in overseas passive funds such as IShares Nasdaq-100 ETF, Lyxor Nasdaq-100 ETF and USAA NASDAQ-100 Index fund. If the underlying fund has a low tracking error, Kotak has eliminated the tracking error from following the index on its own. However, other variables such as time zone, forex, settlement time etc., can still make a big difference. It is, however, too early to pass judgement on this matter.
Tracking error of Motilal Oswal Nasdaq 100 Fund of Fund
Two one year periods can be studied with the base date of 23rd July 2020. The fortunes of the ETF and, therefore, the fund of fund have swing both ways!
| Duration | N100 TR INR Return | FOF Return | ETF NAV Return | ETF Price Return |
| July 23rd 2020 to July 23rd 2021 | 43.2% | 35.9% | 37.2% | 37.1% |
| July 24th 2019 to July 23rd 2020 | 44.6% | 49.4% | 48.2% | 49.5% |
After the fund of fund launch, the AMC has managed to keep the price-nav deviations reasonably low, but the deviations compared to the index have been quite high.
Tracking error of Motilal Oswal Nasdaq 100 ETF
Motilal Oswal AMC failed to efficiently reduce the Nasdaq 100 ETFs price – nav deviations until they launched the fund of fund. In fact, the launch date of the fund of fund can be easily guessed from the ETF’s price and NAV plot!
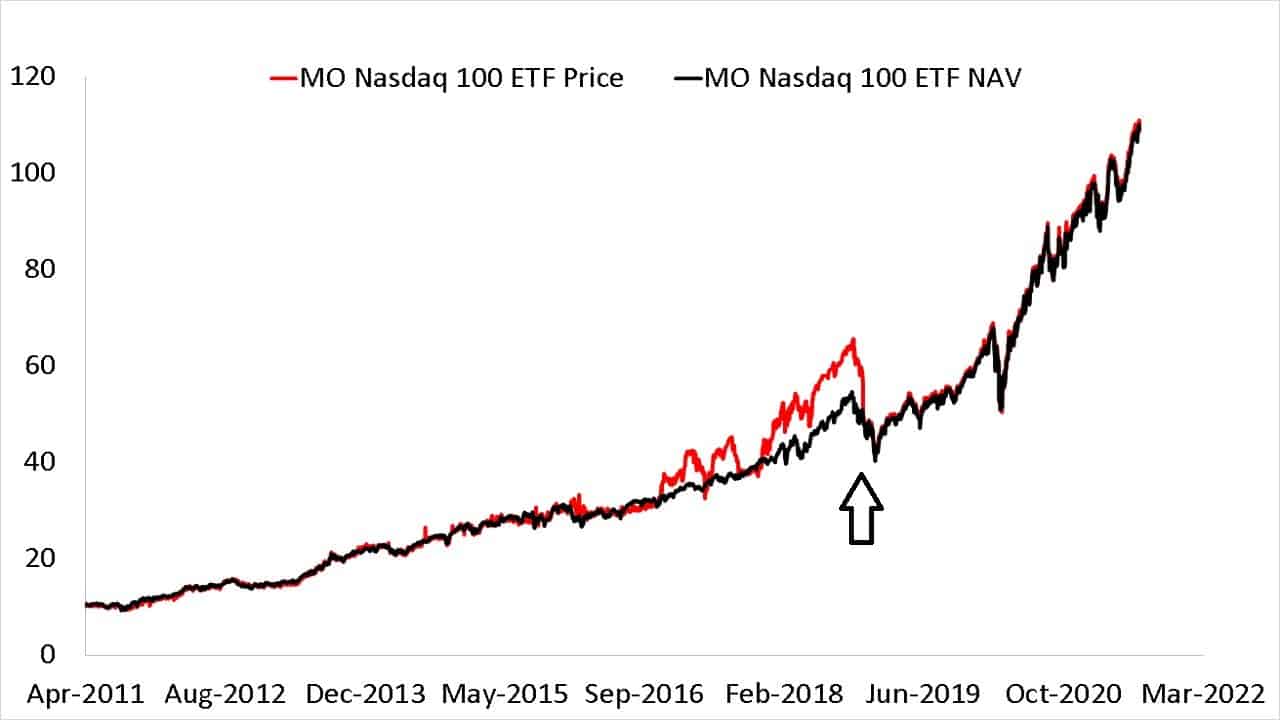
So when I reviewed the fund of fund in its NFO period, I saw some huge price-nav deviations and was one of the reasons for writing this: Motilal Oswal Nasdaq 100 Fund of Fund: Do not invest! I get a lot of stick for this article and associated YouTube video, but I stick with my opinion of “do not invest” in N100 – concentration risk + volatility.
| Duration | N100 TR INR Return | ETF NAV Return | ETF Price Return |
| July 23rd 2020 to July 23rd 2021 | 43% | 37.2% | 37.1% |
| July 24th 2019 to July 23rd 2020 | 45% | 48.2% | 49.5% |
| July 24th 2018 to July 24th 2019 | 10% | 7.8% | -9.7% |
| July 24th 2017 to July 24th 2018 | 35% | 32.0% | 32.2% |
| July 24th 2016 to July 24th 2017 | 23% | 20.8% | 49.5% |
| July 25th 2015 to July 24th 2016 | 9% | 6.5% | 7.6% |
| July 25th 2014 to July 25th 2015 | 24% | 22.5% | 18.0% |
| July 25th 2013 to July 25th 2014 | 33% | 32.9% | 33.9% |
| July 25th 2012 to July 25th 2013 | 28% | 25.0% | 28.9% |
| July 26th 2011 to July 25th 2012 | 35% | 33.9% | 32.7% |
The N100 ETF has seen some years of reasonably low tracking error, but this depends on US market volatility and local supply vs demand.
In summary, these passive investing options have not yet reached a level of consistently low tracking error. Unfortunately, active mutual funds – be it Indian funds investing a small amount in international, equity-like PPFAS Flexicap or wholly international funds – suffer from fund manager risks and high fees.
While we still feel that the Motilal Oswal S&P 500 Index Fund (click the link to check what returns to expect) is the most reasonable option to invest in the US/international market, we should keep an eye on its tracking error and hope it improves in future. Let us hope there are more international passive fund of fund options with low cost, low tracking error ETFs and index funds in future.