Last Updated on May 11, 2022 at 5:00 pm
In this article, we discuss the results of a buy when high, sell when low market timing strategy that surprisingly works with the best results out of all the timing strategies studied so far.
The strategy is identical to the tactical buying strategy for gold discussed a few days ago and is based on the momentum of the six months moving average relative to the twelve-month moving average.
We shall compare a systematic approach which is a simple SIP in 50% equity (Sensex TRI) and 50% gilts (I-BEX gilt index) with annual rebalancing versus a tactical approach which involves moving between equity and cash over ten year periods. Taxes and exit loads for both strategies are not included.
🔥Secure your future with our Robo-advisory tool trusted by over 3,500 investors and advisors. From effortless retirement planning to funding your children’s biggest dreams, turn your financial goals into reality. 🔥
Subscribe for money management solutions via email! (Link takes you to our email sign-up form) Join 32,000+ readers in our community.
👉 New Tool Alert! NaviPlan: A Privacy-Focused Multi-asset Tracker and Goal Planner 👈
Warning and Disclaimer: The following is to be treated as investment research based on past data, need not be representative of practical implementation and is not investment advice. They do not factor in behavioural/emotional aspects associated with investing. If you do not know how to understand a backtest result, and evaluate its disadvantages, then please, please DO NOT play with your money using market timing.
Not all asset allocation variations and investment durations were considered in our backtests. Past results and future results will depend on and vary according to the asset allocation mix used and investment duration considered. For example, for equity, the model works reasonably well with 50% equity or lower equity (rest in fixed income) and not so well for higher equity allocations.
Context: This is an extension of previous work – Timing the market by spotting bullish and bearish trends based on what Jim Otar calls as a hurricane warning chart in his book, “Unveiling the Retirement Myth”. You can use the Nifty Valuation indicator to track the moving averages (the sheet gives daily moving averages while we shall consider monthly averages)
Shown below is the Sensex TRI and the six and twelve-month moving averages. When the six-month moving average (6MMA) is greater than the 12-month moving average (12MMA), we buy equity, sell all gilts and buy equity. Monthly investments are directed only to equity.
When the six-month moving average (6MMA) is less than the 12-month moving average (12MMA), we sell equity and buy gilts with it. Monthly investments are directed only to gilts.
This is counterintuitive because you are shifting to an asset class that is moving up and selling it when it is going down: buying when high, selling when low. Arguably, this is the same as buying a little after the low and selling a little after the high with highs and lows defined by the 6MMA movement.
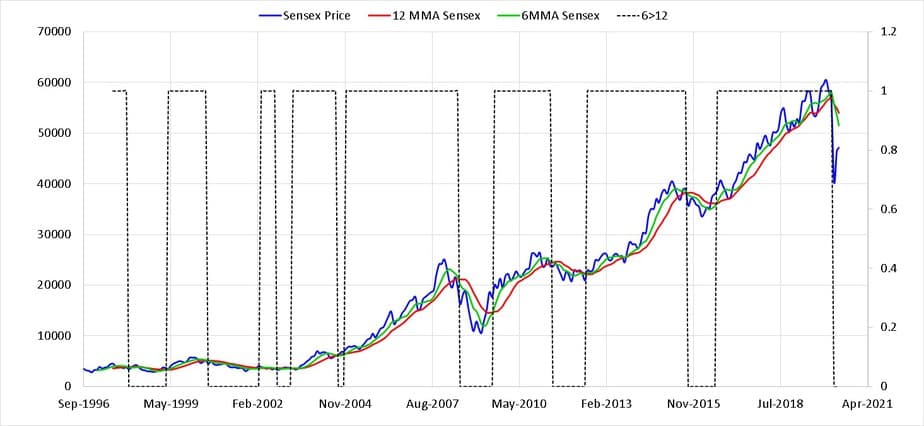
When the 6>12 indicator (dotted line) = 1, we are 100% into equity. When it is = 0, we are 100% into gilts. This strategy needs to backtested and compared a with a 50% equity and 50% gilt systematic strategy.
We will run a 10-year backtest with the ten-year window rolled over like this. Each row is a 10-year run and we have 155 runs like this.
| Start Date | End Date |
| 04-08-1997 | 03-08-2007 |
| 03-09-1997 | 04-09-2007 |
| 03-10-1997 | 03-10-2007 |
| — | — |
| — | — |
| 05-04-2010 | 03-04-2020 |
| 03-05-2010 | 04-05-2020 |
| 03-06-2010 | 28-05-2020 |
The results are shown below. A surprising 150 out of 155 times the tactical strategy won (upper left picture). The price to pay for this outperformance is (1) higher drawdowns (max fall from the peak as shown in upper right frame) (2) higher portfolio volatility (lower left frame) and (3) more no of continuous months when the portfolio was lower than a peak (lower right frame)
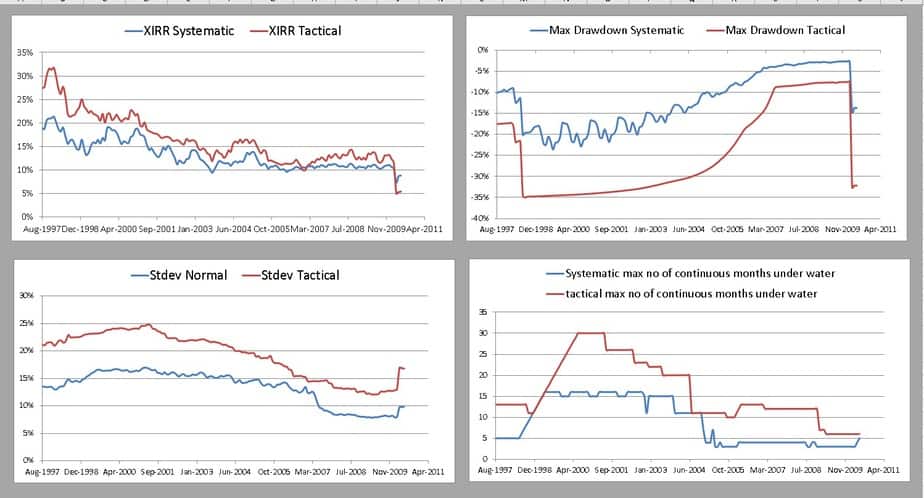
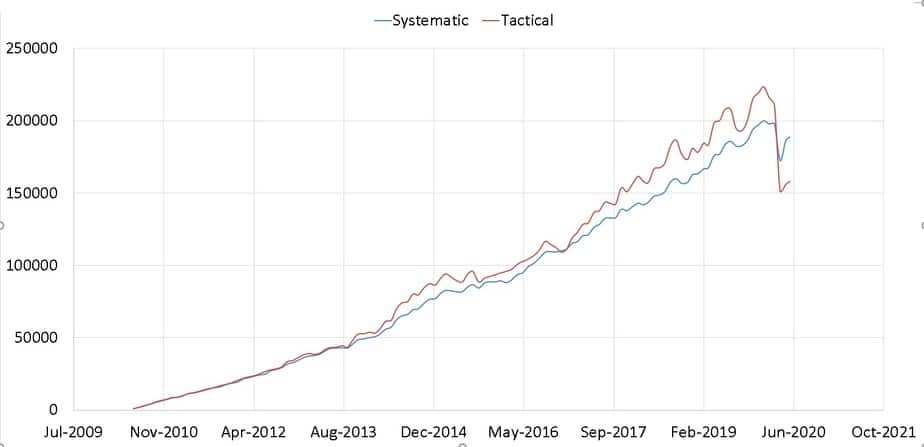
Those who want a high-risk, high-return strategy should take a closer look at this. We have seen from previous backrests that no method would work all the time and this is true for this too. It has failed only thrice – for 10 year runs ending April -start, May-start and May-end. One such run is shown below.
It is premature to:
- declare victory and assume we have found the holy grail of market timing. We will need to test more (see below)
- declare this as a failure just because it did not work during one of the steepest market fall. When you want higher returns, that is a dice you goto roll.
As a first step towards extended testing, we shall switch from Sensex TRI to S&P 500 TRI using Prof. Shiller’s data and switch from I-BEX gilt to US treasury bond (1Y).
Since S&P 500 TRI is available from 1900 (yes, from Excel date = 0!) and bond data only 1962, we shall use the median monthly return of the 1Y bonds = 0.23%. This is clearly an oversimplification but the timing indicator is with respect to the S&P 500 and should reasonably acceptable as a first approximation.
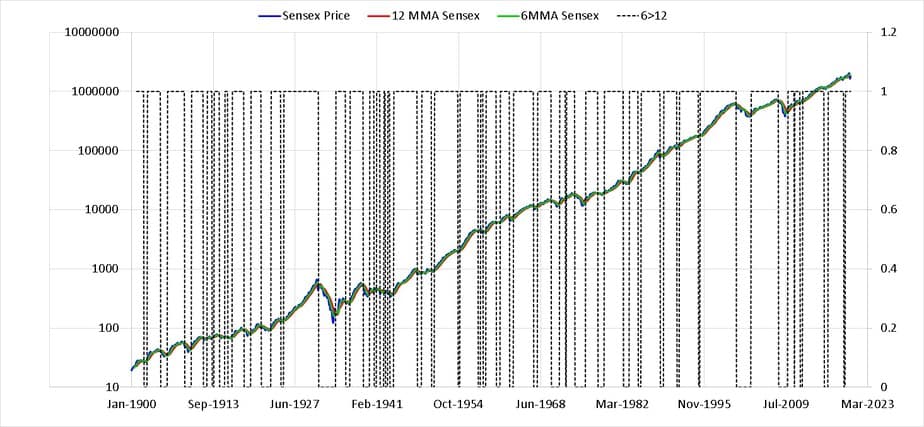
This gives an incredible 1336 10-year windows. Surprise, surprise, the tactical strategy got more returns 1209 times or 90%. Cleary this strategy deserves our attention.
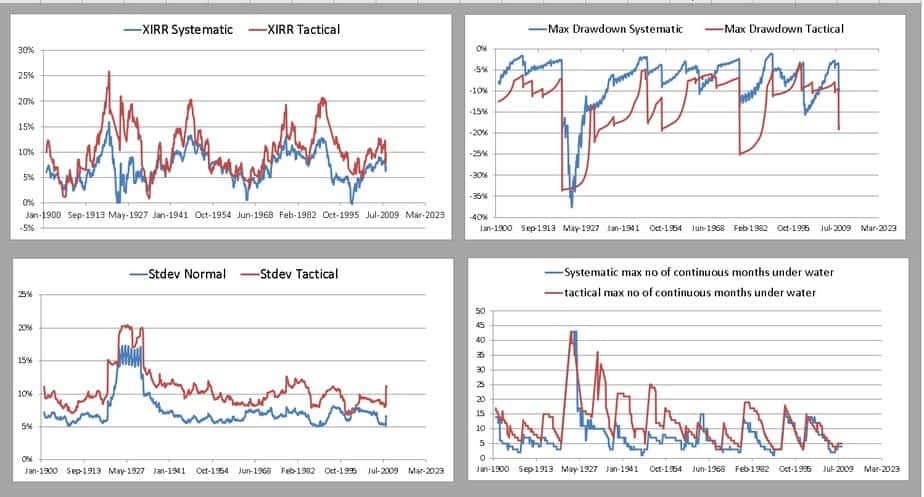
Over 15Y, the win rate is an astounding 99% (1276 runs)
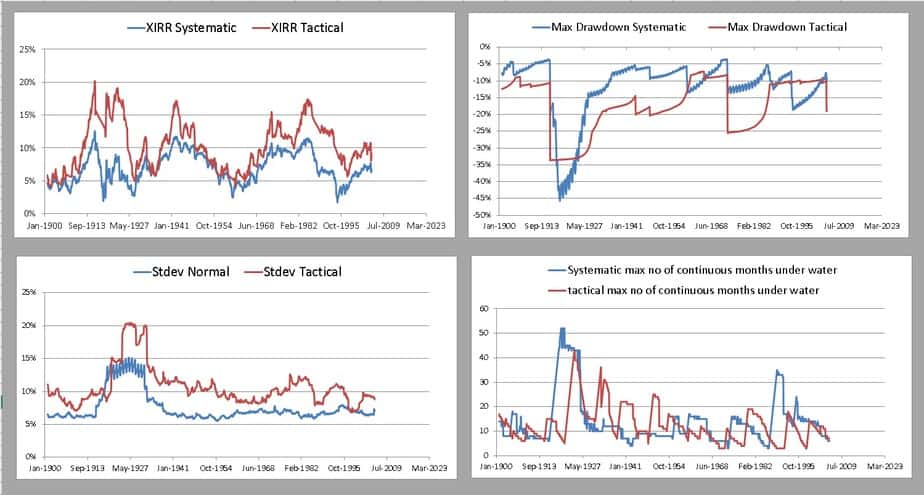
We shall have to do further study with actual US bond rates. Naturally, this is not a foolproof method but even if we include taxes, the win rate is enough to at least sit up and take notice. Kindly do your own due diligence before committing money.
Update: A tool for tactical buying and selling using moving averages is now available.