
A reader asks, “I recently read your review of Tata Nifty Midcap 150 Momentum 50 Index Fund. I wondered if tactical entry and exit with your double-moving average market timing model will provide better results than systematic investing with a momentum index fund. Can you please backtest this?”
We can certainly backtest it, but India’s history of momentum indices is quite short. The inception date of the two NSE momentum indices is only 1st April 2005. The traded data is much shorter.
Also, longer history does not matter much with systematic or tactical investing (aka market timing). There are always new risks emerging. See: A risk in market timing that 122 years of backtesting failed to reveal!
Warning and disclaimer: The strategy outlined in this article and links therein may or may not provide a higher return when you try it. Our backtests reveal that this strategy has a higher risk than systematic investing. It may not always provide a higher reward for the higher risk taken. So users must appreciate this before considering this strategy.
Please recognise results shown in backtests do not factor in future market movements, human emotions, taxation and exit loads. All these would impact the outcome of market timing (aka tactical asset allocation wrt this tool).
🔥Secure your future with our Robo-advisory tool trusted by over 3,500 investors and advisors. From effortless retirement planning to funding your children’s biggest dreams, turn your financial goals into reality. 🔥
Subscribe for money management solutions via email! (Link takes you to our email sign-up form) Join 32,000+ readers in our community.
👉 New Tool Alert! NaviPlan: A Privacy-Focused Multi-asset Tracker and Goal Planner 👈
Not all asset allocation variations and investment durations were considered in our backtests. Past and future results will depend on and vary according to the asset allocation mix and investment duration considered. For example, for equity, the model works reasonably well with 50% equity or lower equity (rest in fixed income) and not so well for higher equity allocations.
Our backtests indicate that the model fails for sharp price changes (up or down, e.g. the March 2020 market crash) and the following sequence of returns. No single strategy would work for all markets and at all times.
Anyone who uses this strategy or the associated tool does so at their own risk. Freefincal or this author/editor is not responsible or liable for any gains or losses resulting from this strategy or tool.
The data: We shall use Nifty Midcap 150 Momentum 50 Total Returns Index data. For debt, we shall assume the availability of an instrument offering 6% a year post-tax.
Asset allocation: 50% equity and 50% debt. Results will depend on the asset allocation used.
Systematic investing: A sum is invested each month in equity and debt. We shall consider 50% equity and 50% debt over three, seven, and ten years. The portfolio is rebalanced annually. Taxes and exit loads due to this are not considered.
Tactical investing: If the six -months moving average (6MMA) of the equity index is greater than the 12-month moving average (12MMA), then all debt holdings are sold and invested in equity. All future investments are also made in equity.
If 6MMA < 12 MMA, all equity holdings are sold and invested in debt. All future investments are also made in debt. Tax and exit load due to the switches are not considered. However, typically the average number of switches is lesser than annual rebalancing. For example, the no of buy/sell switches over 5 years is only about twice on average. Over seven years, it is only three on average. The buy/sell signal and the moving averages are shown below.
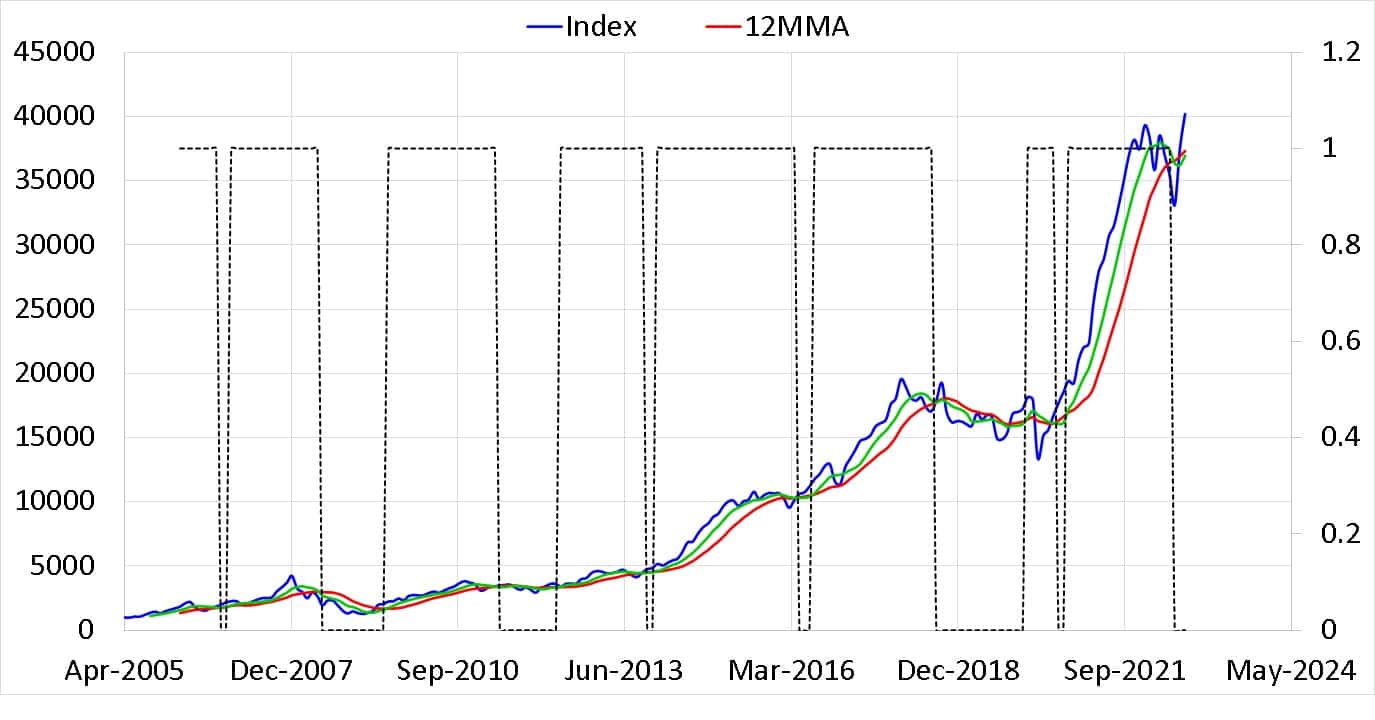
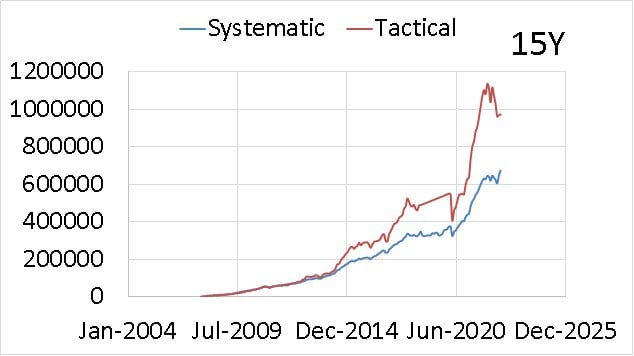
This is an example of a single backtest over the last 15Y. It is important not to get carried away with this as it is just one run.
Five years:
- No of runs: 150
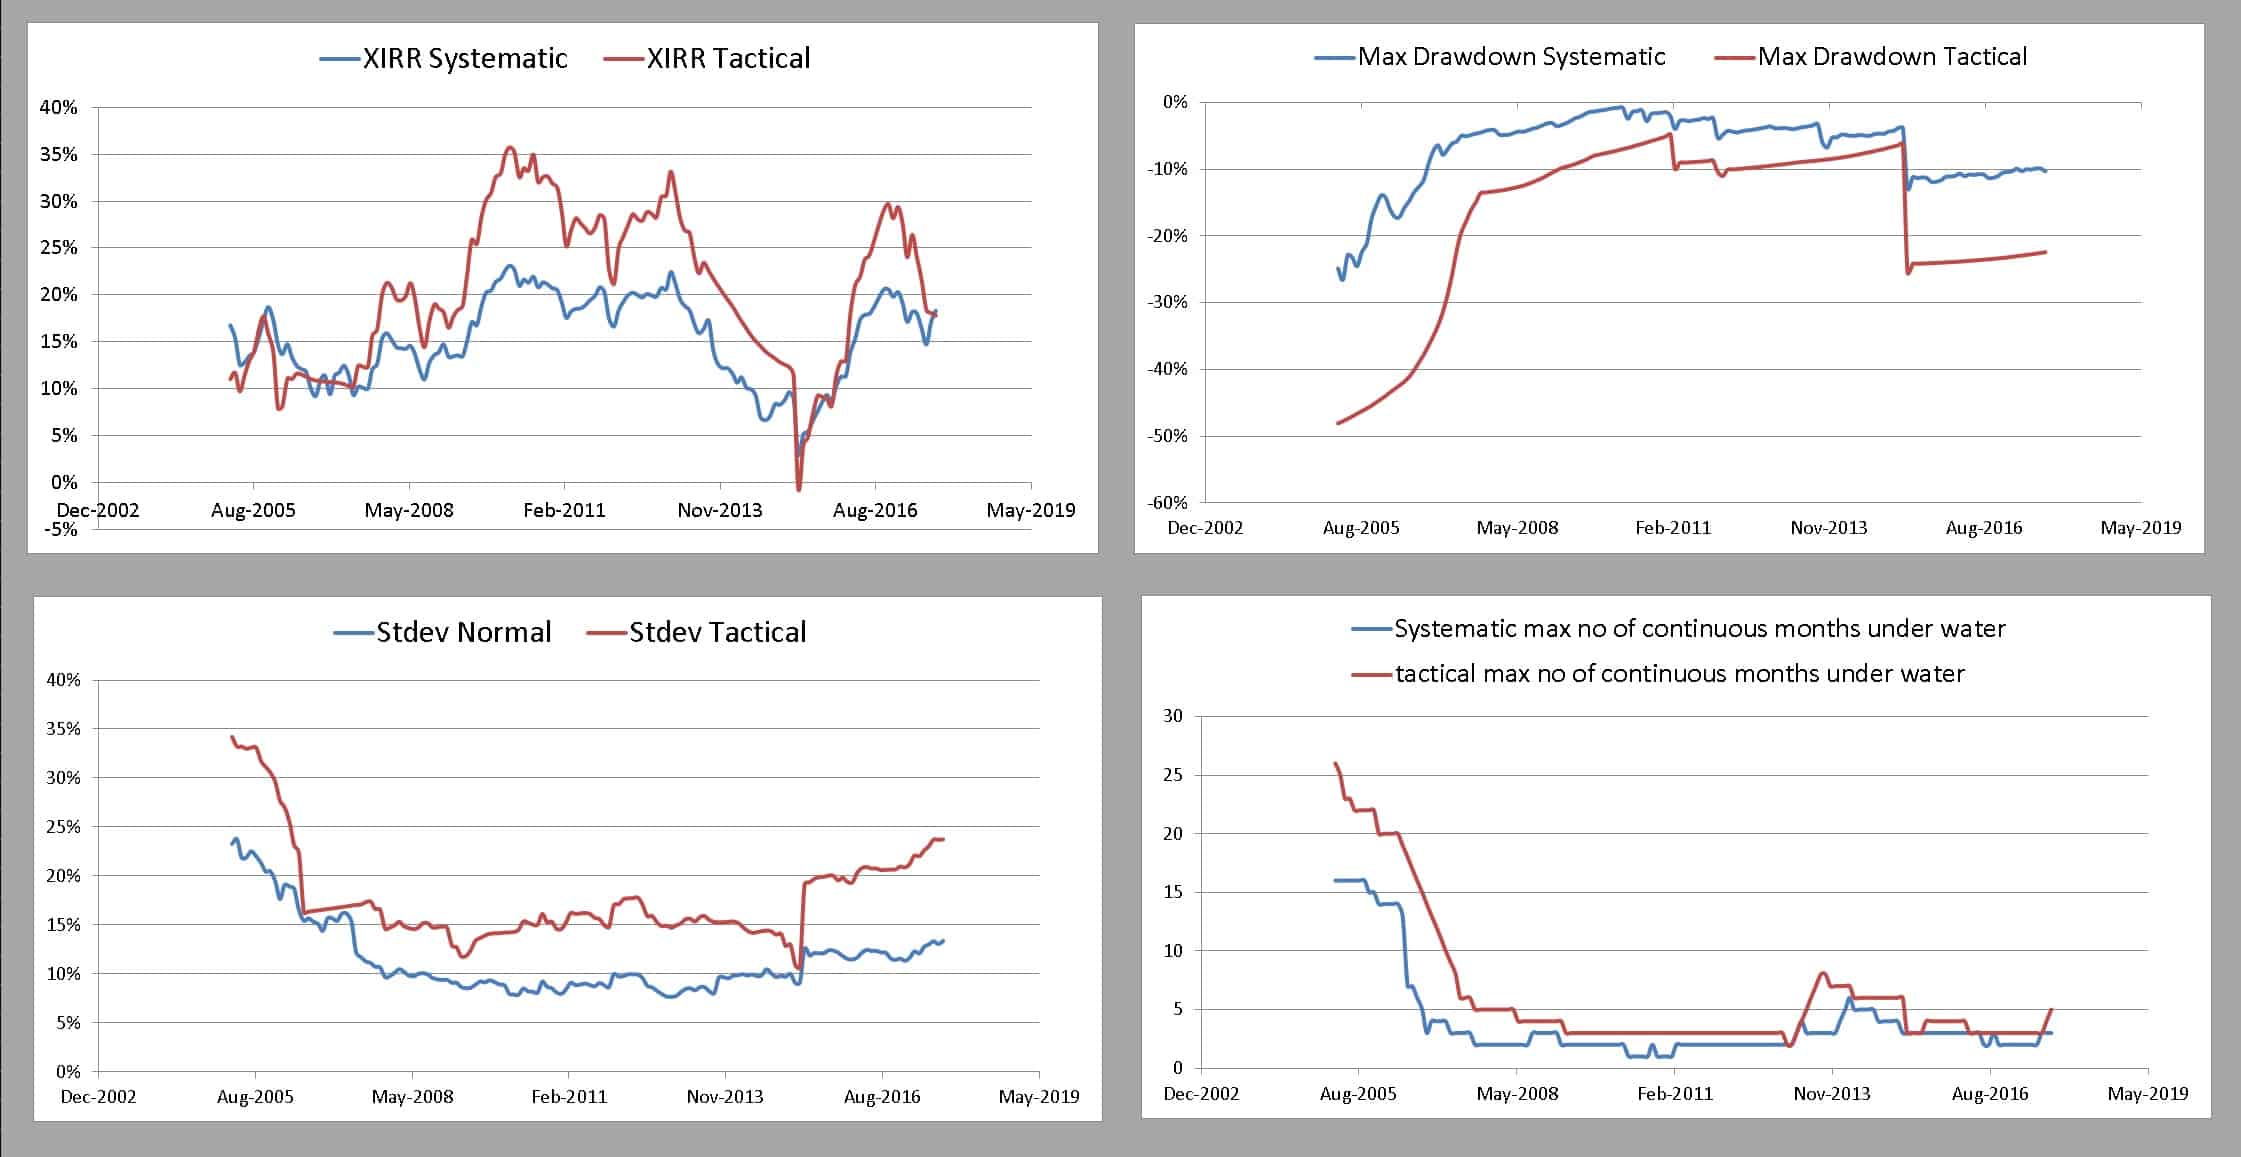
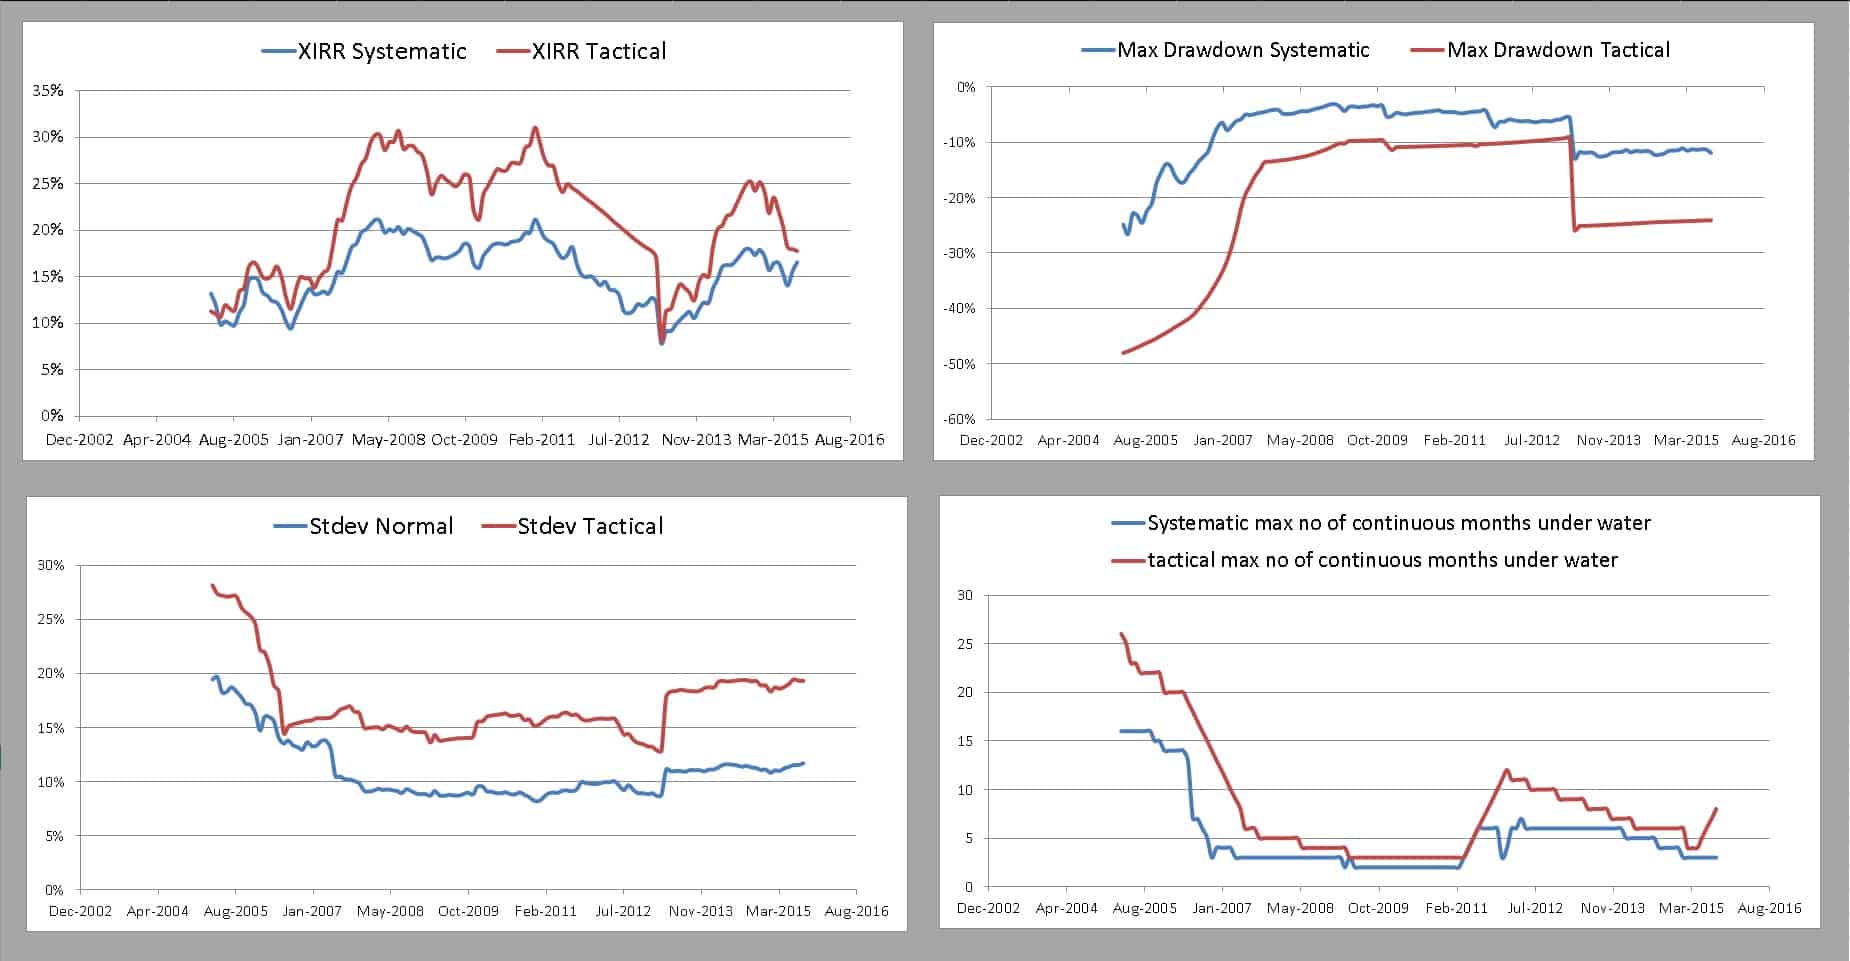
- Top left panel: the XIRR. For the period studied, the tactical strategy has done quite well.
- Top right panel: The portfolio’s maximum drawdown (max fall from peak) is shown (less negative, the better). The tactical strategy often has a higher drawdown. That is a higher risk.
- Bottom left panel: The standard deviation or volatility (lower the better). The tactical approach has higher volatility.
- Bottom right panel: the max no of months the portfolio was below its peak or underwater (lower the better). Often the tactical strategy takes longer to recover.
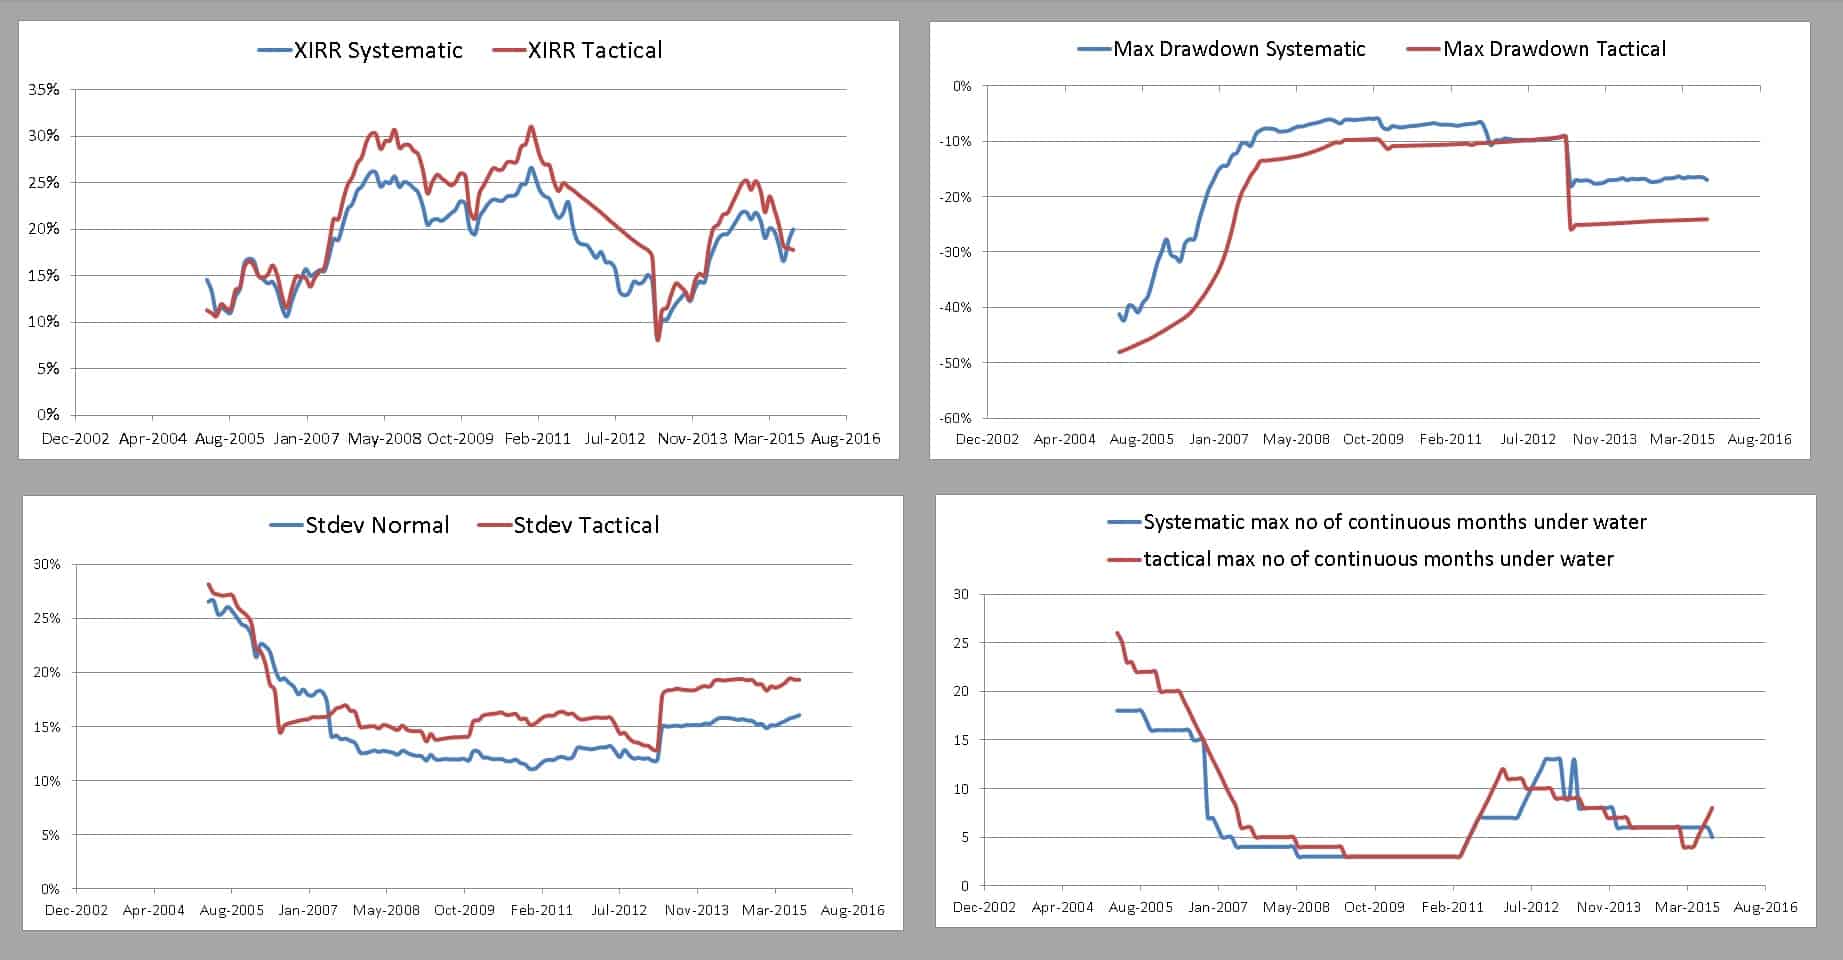
It must be understood that the results depend on the asset allocation chosen. For example, the above is 50% equity and 50% debt. If we change this to 70% equity and 30% equity, then the five-year results look like this.
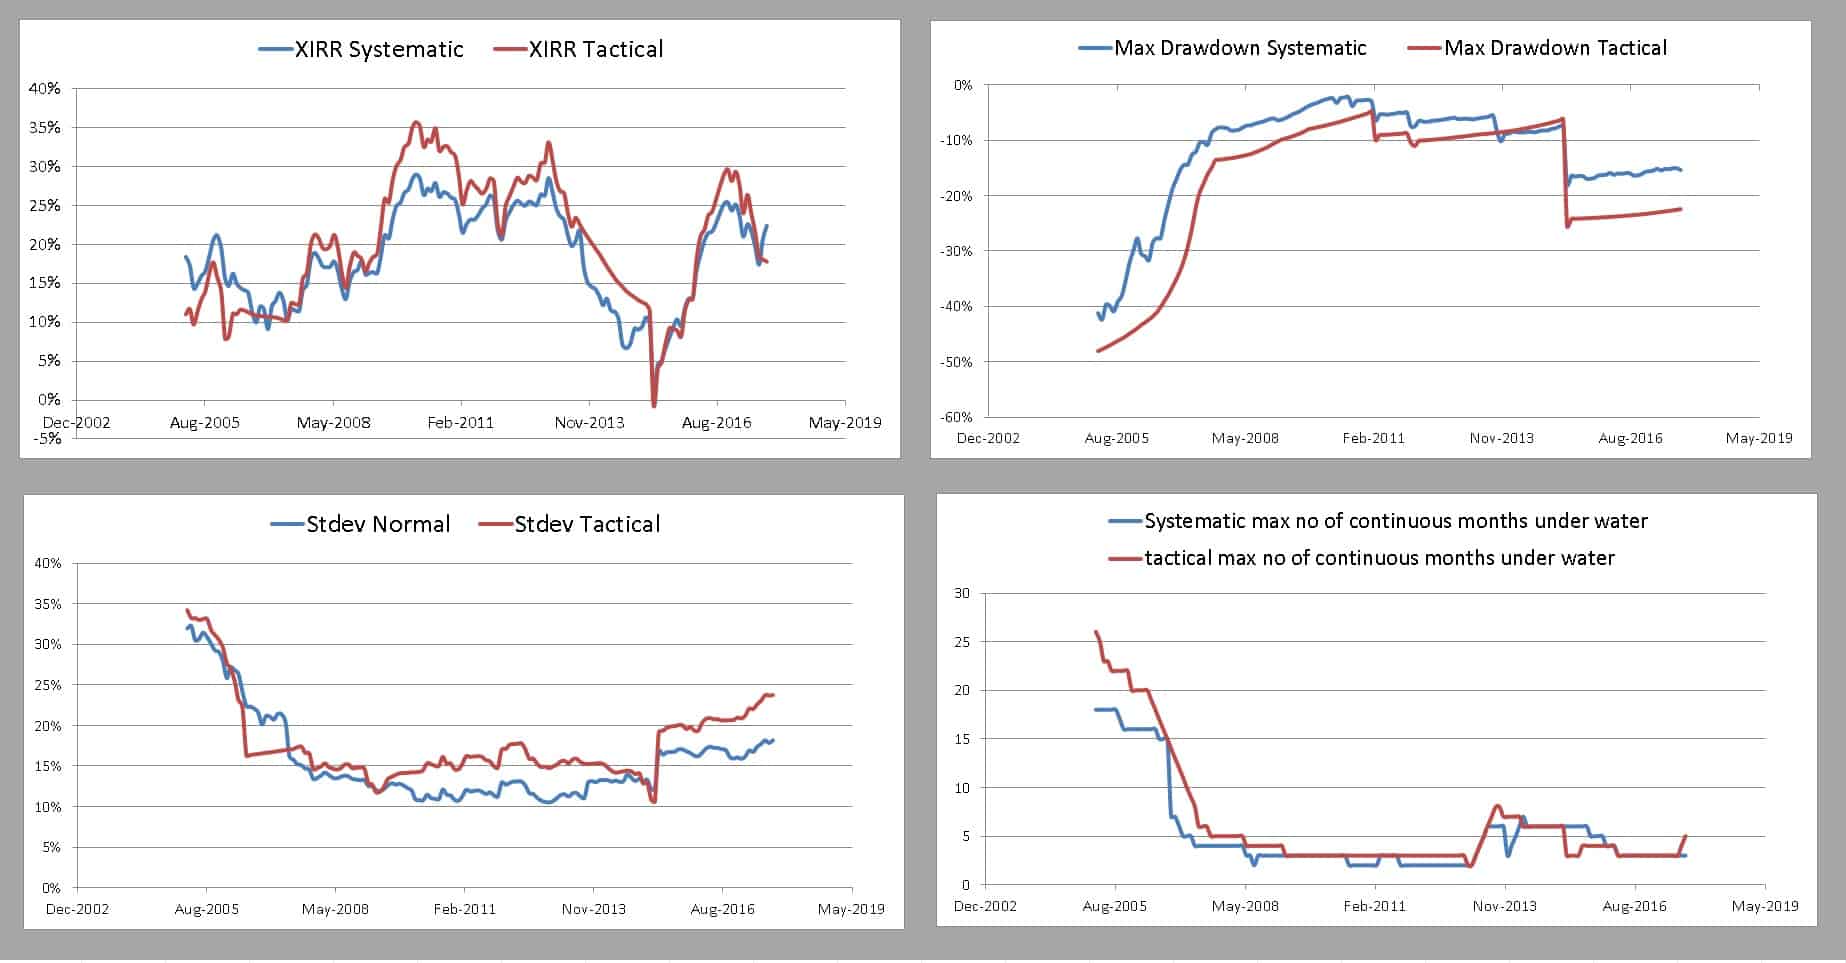
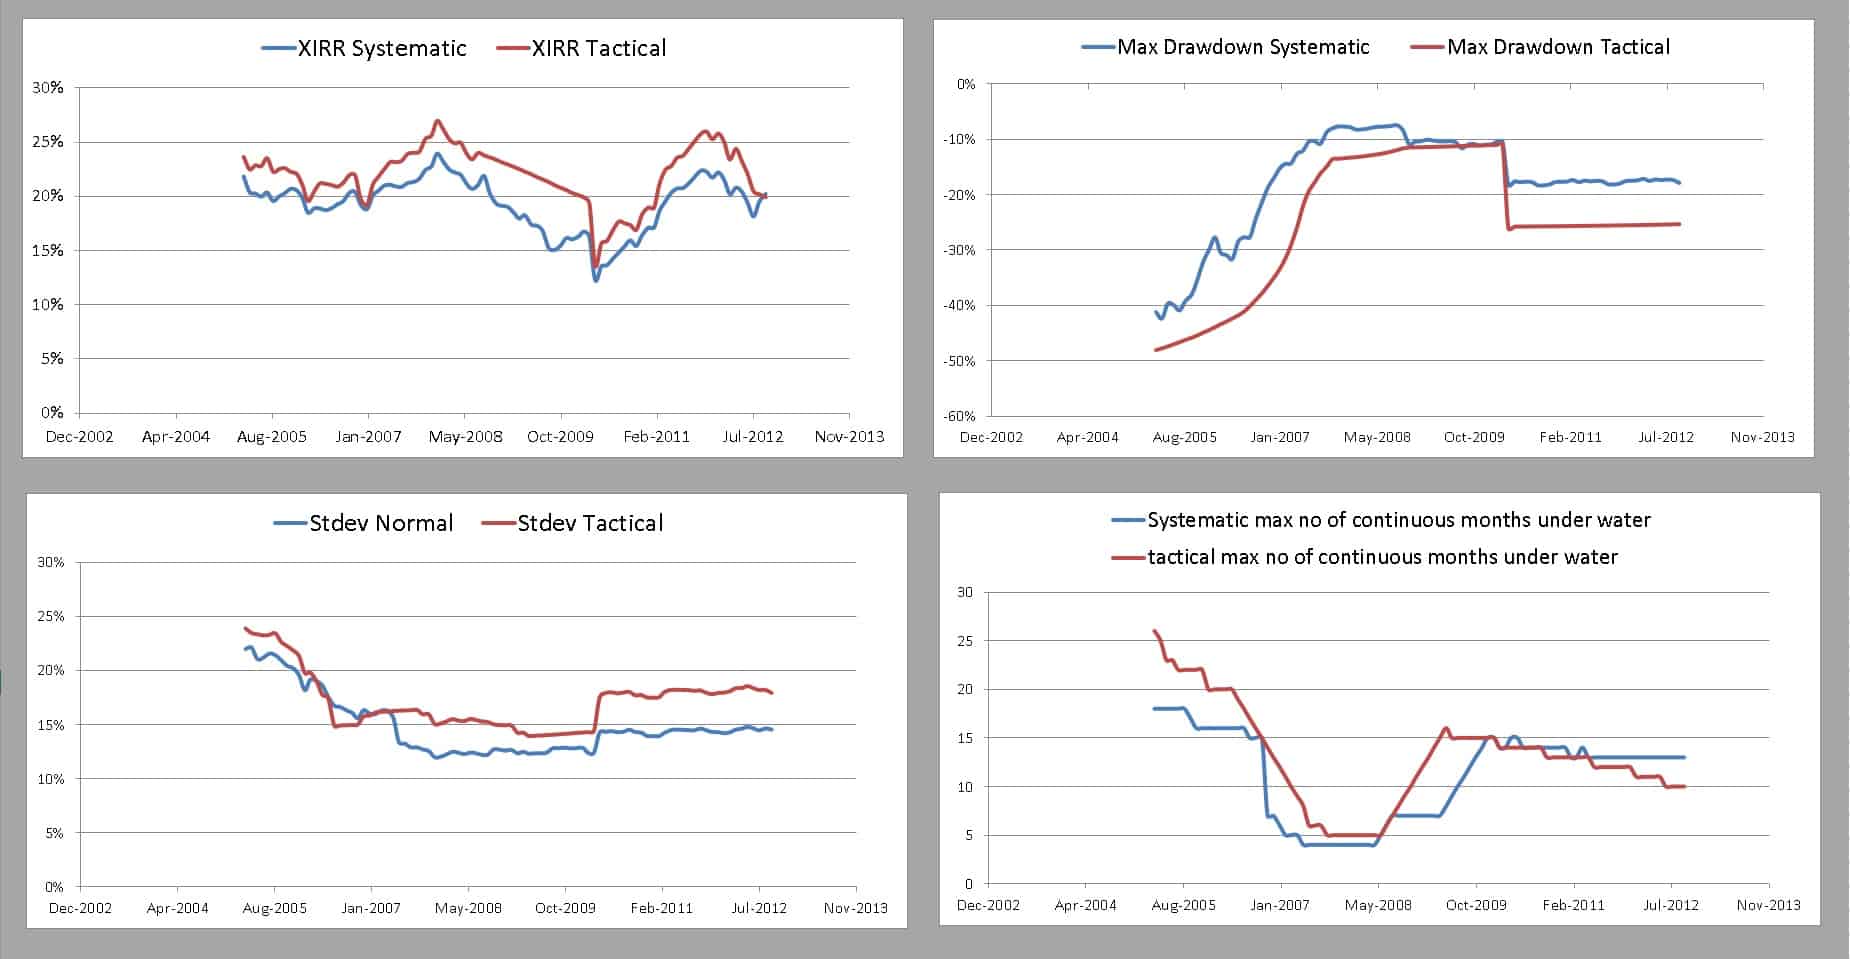
Notice that the margin of outperformance of the tactical strategy has significantly reduced. The tactical strategy is less rewarding compared to the 50:50 allocation. The higher risk associated with the tactical strategy has also decreased. This pattern is also observed over 7 and 10 years. This is a key feature that must always be kept in mind.
50% Equity and 50% debt over seven years (126 intervals)
70% Equity and 30% debt over seven years (126 intervals)
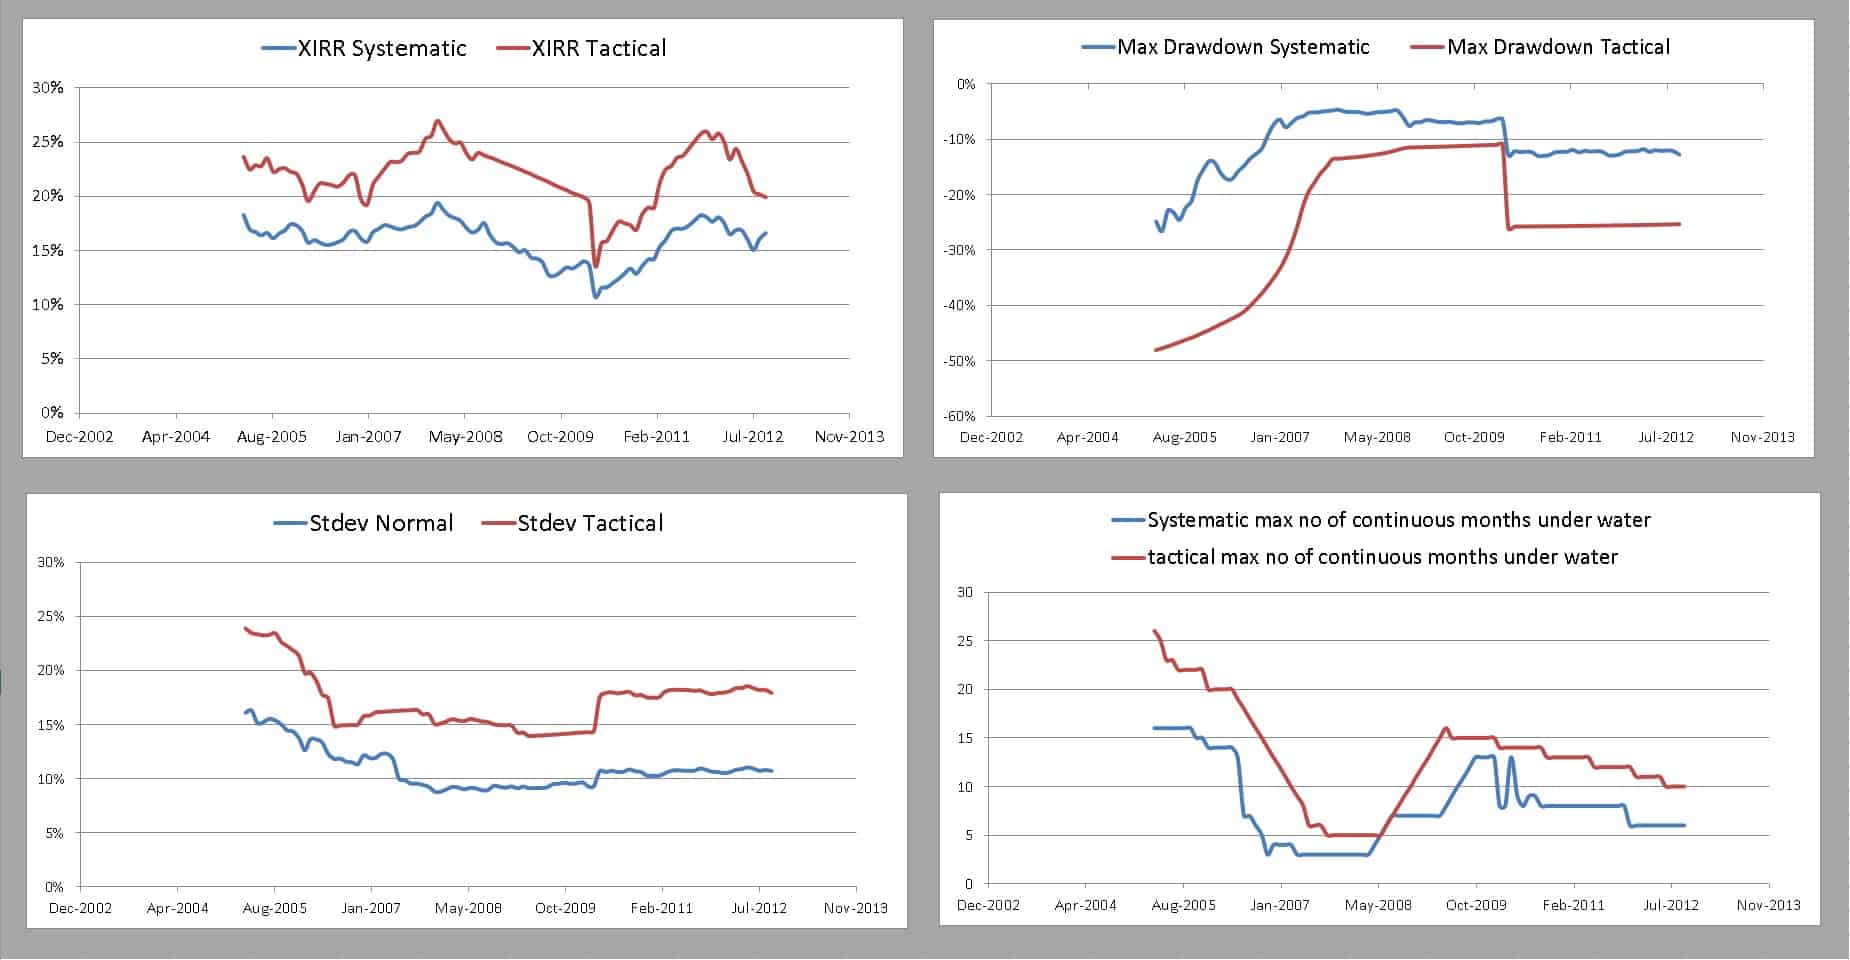
50% Equity and 50% debt over ten years (90 intervals)
70% Equity and 30% debt over ten years (90 intervals)
Results of the double-moving average market timing model applied to a momentum index do seem promising. However, it must be understood that the model may not work well with sudden and sharp index movements. Those with small exposure to a momentum index or a small cap fund can consider the strategy after appreciating its risks. See: Do not use SIPs for Small Cap Mutual Funds: Try this instead!