Last Updated on December 29, 2021 at 11:54 am
One of the common newbie questions regarding mutual fund SIPs is: What is the best date to start a mutual fund SIP? Nothing wrong with the question, but as in most cases, the answers are often wrong. In this post, I discuss the data of 4147 10-year Sensex SIP retuns computed between Jan 1991 and Sep 2008 to find out if there is a “best date” for starting a SIP.
Anyone who has stared at market graphs long enough will tell you that is not possible to find such patterns in the stock market. That is fine one day that will offer better returns. If this is possible, the entire math associated with the markets will have to be re-written. It is one thing to talk about this and another to show proof. That is what I would like to do in this post.
To be frank, I have better things to do with my time, but as they say there is a sucker born every minute to read the biased analysis of a short-sighted analyst (also born every minute). Therefore it becomes necessary to dig deep and publish results that are not of any personal use.
How to find the best date to start a mutual fund SIP (if there is one)
1: Get Sensex data. I have used data from Jan 1991.
🔥Secure your future with our Robo-advisory tool trusted by over 3,500 investors and advisors. From effortless retirement planning to funding your children’s biggest dreams, turn your financial goals into reality. 🔥
Subscribe for money management solutions via email! (Link takes you to our email sign-up form) Join 32,000+ readers in our community.
👉 New Tool Alert! NaviPlan: A Privacy-Focused Multi-asset Tracker and Goal Planner 👈
2: Choose a 10-year SIP period (reasonably long enough and something that most investors do not do)
3: Run a 10Y SIP starting on 1st July1991. The return is 10.903% (the reason for excessive decimals should be obvious below). Then shift the 10Y SIP by a day. So the next SIP starts on 2nd July 1991 and so on.
4: So the first 1st SIP date = 1st, 2nd SIP date = 2nd, 3rd SIP date = 3rd and so on. We get 21 SIP dates in July 1991 and the returns are plotted below.

Please look at the difference in returns in the x-axis. Any investor with half a brain will see this graph and recognise that there is no such thing as “best date for SIP” and move on to other things like for example yesterdays post: How to select suitable debt mutual funds with low credit risk? You are more than welcome to read on as an analyst
As an analyst, we should not get satisfied so easily. We need to repeat the above excercise for Aug 1991, Sep 1991, ….. When this is done, we end up 207 months of such data and a total of 4147 10-year SIP returns.
Result: Is there a best date to start a SIP?
The difference between the max SIP return and the minimum SIP return for each of those 207 months is shown below.
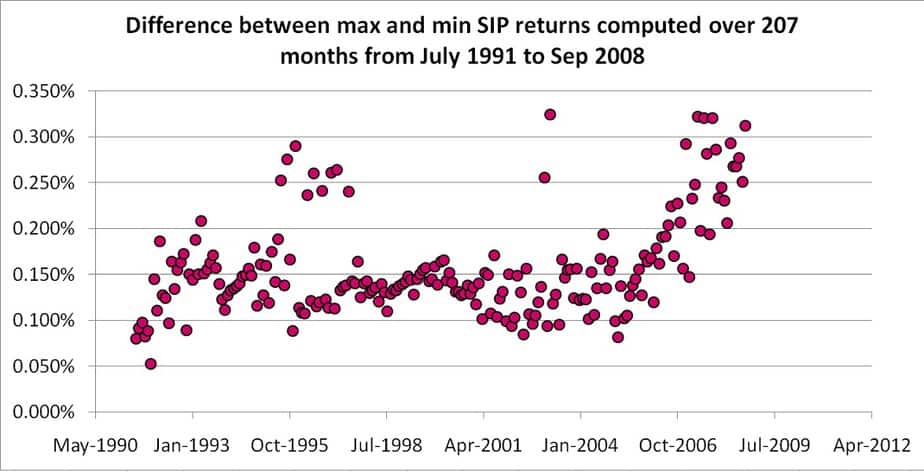
This enough proof that you get no great advantage in picking and choosing a SIP for better returns. That is simply not possible. The difference is simply too small. Each month has about 18-20 trading days. Aside from the max and min, there will still be about 16-17 other returns possible. Stop searching for the best SIP date!! IT DOES NOT EXIST!
Here is the full table of results.
| Month & Year | Difference between max and min return | Max return SIP date falls after 15th of the month(1 = yes and 0 = No) | Min Return SIP date falls before 15th of the month (1 = yes and 0 = No) |
| 7-1991 | 0.08037% | 1 | 0 |
| 8-1991 | 0.09169% | 1 | 0 |
| 9-1991 | 0.09773% | 1 | 0 |
| 10-1991 | 0.08271% | 1 | 1 |
| 11-1991 | 0.08853% | 1 | 1 |
| 12-1991 | 0.05274% | 1 | 1 |
| 1-1992 | 0.14514% | 1 | 1 |
| 2-1992 | 0.11094% | 1 | 0 |
| 3-1992 | 0.18654% | 1 | 1 |
| 4-1992 | 0.12744% | 1 | 1 |
| 5-1992 | 0.12460% | 1 | 0 |
| 6-1992 | 0.09663% | 1 | 1 |
| 7-1992 | 0.16426% | 1 | 0 |
| 8-1992 | 0.13410% | 1 | 1 |
| 9-1992 | 0.15496% | 1 | 1 |
| 10-1992 | 0.16333% | 1 | 1 |
| 11-1992 | 0.17218% | 1 | 1 |
| 12-1992 | 0.08953% | 1 | 1 |
| 1-1993 | 0.15068% | 1 | 1 |
| 2-1993 | 0.14397% | 1 | 1 |
| 3-1993 | 0.18767% | 1 | 1 |
| 4-1993 | 0.15008% | 1 | 1 |
| 5-1993 | 0.20870% | 1 | 1 |
| 6-1993 | 0.15090% | 1 | 1 |
| 7-1993 | 0.15570% | 1 | 1 |
| 8-1993 | 0.16278% | 1 | 1 |
| 9-1993 | 0.17066% | 1 | 1 |
| 10-1993 | 0.15706% | 1 | 1 |
| 11-1993 | 0.14010% | 1 | 1 |
| 12-1993 | 0.12329% | 1 | 1 |
| 1-1994 | 0.11151% | 1 | 1 |
| 2-1994 | 0.12733% | 1 | 1 |
| 3-1994 | 0.13261% | 1 | 1 |
| 4-1994 | 0.13514% | 1 | 1 |
| 5-1994 | 0.13708% | 1 | 1 |
| 6-1994 | 0.14076% | 1 | 1 |
| 7-1994 | 0.14834% | 1 | 1 |
| 8-1994 | 0.14958% | 1 | 1 |
| 9-1994 | 0.15643% | 1 | 1 |
| 10-1994 | 0.14905% | 1 | 1 |
| 11-1994 | 0.17917% | 1 | 1 |
| 12-1994 | 0.11583% | 1 | 1 |
| 1-1995 | 0.16133% | 1 | 1 |
| 2-1995 | 0.12765% | 1 | 1 |
| 3-1995 | 0.15949% | 1 | 1 |
| 4-1995 | 0.11917% | 1 | 1 |
| 5-1995 | 0.17473% | 1 | 1 |
| 6-1995 | 0.14187% | 1 | 1 |
| 7-1995 | 0.18834% | 1 | 1 |
| 8-1995 | 0.25278% | 1 | 1 |
| 9-1995 | 0.13847% | 1 | 1 |
| 10-1995 | 0.27561% | 1 | 1 |
| 11-1995 | 0.16627% | 1 | 1 |
| 12-1995 | 0.08877% | 1 | 1 |
| 1-1996 | 0.28993% | 1 | 1 |
| 2-1996 | 0.11374% | 1 | 1 |
| 3-1996 | 0.10873% | 1 | 1 |
| 4-1996 | 0.10749% | 1 | 1 |
| 5-1996 | 0.23690% | 1 | 1 |
| 6-1996 | 0.12132% | 1 | 1 |
| 7-1996 | 0.26041% | 1 | 1 |
| 8-1996 | 0.11534% | 1 | 1 |
| 9-1996 | 0.11961% | 1 | 1 |
| 10-1996 | 0.24104% | 1 | 1 |
| 11-1996 | 0.12305% | 1 | 1 |
| 12-1996 | 0.11350% | 1 | 1 |
| 1-1997 | 0.26106% | 1 | 1 |
| 2-1997 | 0.11324% | 1 | 1 |
| 3-1997 | 0.26425% | 1 | 1 |
| 4-1997 | 0.13272% | 1 | 1 |
| 5-1997 | 0.13691% | 1 | 1 |
| 6-1997 | 0.13814% | 1 | 1 |
| 7-1997 | 0.24036% | 1 | 1 |
| 8-1997 | 0.14314% | 1 | 1 |
| 9-1997 | 0.14016% | 1 | 1 |
| 10-1997 | 0.16435% | 1 | 1 |
| 11-1997 | 0.12556% | 1 | 1 |
| 12-1997 | 0.14084% | 1 | 1 |
| 1-1998 | 0.14240% | 1 | 1 |
| 2-1998 | 0.12950% | 1 | 1 |
| 3-1998 | 0.13320% | 1 | 1 |
| 4-1998 | 0.13569% | 1 | 1 |
| 5-1998 | 0.12070% | 1 | 1 |
| 6-1998 | 0.13955% | 1 | 1 |
| 7-1998 | 0.13057% | 1 | 1 |
| 8-1998 | 0.11000% | 1 | 1 |
| 9-1998 | 0.12879% | 1 | 1 |
| 10-1998 | 0.13368% | 1 | 1 |
| 11-1998 | 0.13271% | 1 | 1 |
| 12-1998 | 0.13758% | 1 | 1 |
| 1-1999 | 0.14003% | 1 | 1 |
| 2-1999 | 0.14192% | 1 | 1 |
| 3-1999 | 0.14783% | 1 | 1 |
| 4-1999 | 0.14411% | 1 | 1 |
| 5-1999 | 0.12863% | 1 | 1 |
| 6-1999 | 0.14514% | 1 | 1 |
| 7-1999 | 0.15053% | 1 | 1 |
| 8-1999 | 0.15511% | 1 | 1 |
| 9-1999 | 0.15741% | 1 | 1 |
| 10-1999 | 0.14268% | 1 | 1 |
| 11-1999 | 0.14511% | 1 | 1 |
| 12-1999 | 0.15846% | 1 | 1 |
| 1-2000 | 0.13928% | 1 | 1 |
| 2-2000 | 0.16414% | 1 | 1 |
| 3-2000 | 0.16549% | 1 | 1 |
| 4-2000 | 0.14334% | 1 | 1 |
| 5-2000 | 0.15226% | 1 | 1 |
| 6-2000 | 0.14147% | 1 | 1 |
| 7-2000 | 0.13103% | 1 | 1 |
| 8-2000 | 0.13165% | 1 | 0 |
| 9-2000 | 0.12790% | 1 | 1 |
| 10-2000 | 0.12875% | 1 | 1 |
| 11-2000 | 0.13831% | 1 | 0 |
| 12-2000 | 0.12915% | 1 | 0 |
| 1-2001 | 0.13613% | 1 | 0 |
| 2-2001 | 0.11795% | 1 | 1 |
| 3-2001 | 0.14081% | 1 | 0 |
| 4-2001 | 0.10123% | 1 | 1 |
| 5-2001 | 0.15207% | 1 | 0 |
| 6-2001 | 0.14955% | 1 | 0 |
| 7-2001 | 0.10792% | 1 | 1 |
| 8-2001 | 0.17123% | 1 | 0 |
| 9-2001 | 0.10418% | 1 | 1 |
| 10-2001 | 0.12407% | 1 | 0 |
| 11-2001 | 0.13159% | 1 | 0 |
| 12-2001 | 0.09919% | 1 | 1 |
| 1-2002 | 0.15027% | 1 | 0 |
| 2-2002 | 0.09358% | 1 | 1 |
| 3-2002 | 0.10311% | 1 | 1 |
| 4-2002 | 0.14887% | 1 | 1 |
| 5-2002 | 0.13094% | 1 | 0 |
| 6-2002 | 0.08497% | 1 | 1 |
| 7-2002 | 0.15661% | 1 | 1 |
| 8-2002 | 0.10678% | 1 | 1 |
| 9-2002 | 0.09655% | 1 | 1 |
| 10-2002 | 0.10505% | 1 | 0 |
| 11-2002 | 0.12020% | 0 | 0 |
| 12-2002 | 0.13647% | 1 | 0 |
| 1-2003 | 0.25558% | 1 | 0 |
| 2-2003 | 0.09413% | 1 | 1 |
| 3-2003 | 0.32439% | 1 | 0 |
| 4-2003 | 0.11832% | 1 | 0 |
| 5-2003 | 0.12844% | 1 | 0 |
| 6-2003 | 0.09584% | 1 | 1 |
| 7-2003 | 0.16665% | 1 | 0 |
| 8-2003 | 0.14635% | 1 | 0 |
| 9-2003 | 0.15476% | 1 | 0 |
| 10-2003 | 0.15582% | 1 | 0 |
| 11-2003 | 0.12438% | 1 | 1 |
| 12-2003 | 0.15666% | 1 | 0 |
| 1-2004 | 0.12228% | 1 | 1 |
| 2-2004 | 0.12391% | 1 | 1 |
| 3-2004 | 0.12295% | 1 | 1 |
| 4-2004 | 0.10153% | 0 | 1 |
| 5-2004 | 0.15283% | 0 | 0 |
| 6-2004 | 0.10580% | 0 | 0 |
| 7-2004 | 0.13482% | 0 | 0 |
| 8-2004 | 0.16712% | 0 | 0 |
| 9-2004 | 0.19417% | 0 | 0 |
| 10-2004 | 0.13519% | 0 | 0 |
| 11-2004 | 0.15523% | 0 | 0 |
| 12-2004 | 0.16452% | 0 | 0 |
| 1-2005 | 0.09940% | 0 | 1 |
| 2-2005 | 0.08207% | 0 | 0 |
| 3-2005 | 0.13771% | 0 | 0 |
| 4-2005 | 0.10258% | 0 | 0 |
| 5-2005 | 0.10544% | 0 | 0 |
| 6-2005 | 0.12713% | 0 | 0 |
| 7-2005 | 0.13791% | 0 | 0 |
| 8-2005 | 0.14505% | 0 | 0 |
| 9-2005 | 0.15580% | 0 | 0 |
| 10-2005 | 0.12766% | 0 | 0 |
| 11-2005 | 0.17107% | 0 | 0 |
| 12-2005 | 0.16451% | 0 | 0 |
| 1-2006 | 0.16785% | 0 | 0 |
| 2-2006 | 0.12000% | 0 | 1 |
| 3-2006 | 0.17878% | 0 | 0 |
| 4-2006 | 0.16213% | 0 | 0 |
| 5-2006 | 0.19059% | 0 | 0 |
| 6-2006 | 0.19137% | 0 | 0 |
| 7-2006 | 0.20405% | 0 | 0 |
| 8-2006 | 0.22434% | 0 | 0 |
| 9-2006 | 0.17029% | 0 | 0 |
| 10-2006 | 0.22778% | 1 | 0 |
| 11-2006 | 0.20702% | 0 | 0 |
| 12-2006 | 0.15665% | 1 | 0 |
| 1-2007 | 0.29218% | 0 | 0 |
| 2-2007 | 0.14738% | 1 | 1 |
| 3-2007 | 0.23303% | 1 | 0 |
| 4-2007 | 0.24837% | 0 | 0 |
| 5-2007 | 0.32203% | 0 | 0 |
| 6-2007 | 0.19792% | 0 | 0 |
| 7-2007 | 0.32055% | 0 | 0 |
| 8-2007 | 0.28131% | 0 | 0 |
| 9-2007 | 0.19391% | 0 | 1 |
| 10-2007 | 0.32055% | 0 | 0 |
| 11-2007 | 0.28641% | 1 | 0 |
| 12-2007 | 0.23394% | 0 | 0 |
| 1-2008 | 0.24541% | 0 | 0 |
| 2-2008 | 0.23091% | 0 | 0 |
| 3-2008 | 0.20584% | 0 | 1 |
| 4-2008 | 0.29300% | 0 | 0 |
| 5-2008 | 0.26795% | 1 | 0 |
| 6-2008 | 0.26763% | 0 | 0 |
| 7-2008 | 0.27684% | 0 | 0 |
| 8-2008 | 0.25144% | 0 | 0 |
| 9-2008 | 0.31225% | 0 | 0 |
There are some interesting insighte regarding WHEN the max SIP return and min SIP return occurs.
The min SIP return occured before the 15th of the month ~ 63% of the 207 months. The max SIP return occured after 15th ~ 76%. HOWEVER, after April 2004, the min occured before 15th and max after 15th only ~ 11% of the 54 months studied.
Conclusion
So don’t go about assuming there is a pattern when there is none! There is no best date for starting a SIP. In fact, as explained here: MF FAQ: part 1 and here: MF FAQ: part 2 there is no need for you to start a SIP and I recommend that you don’t. Just invest as much as possible whenever you get money (each month for many) directly by making a manual transaction at the AMC site.
Do not waste time on such trivial matters. If you want to become rich, you should first think like a rich person and not worry about peanuts.
We are on Google News
Use this button to add freefincal.com as a preferred personal finance source on Google News. 
Add freefincal as a preferred news source
You can also follow freefincal on Google News. 
Explore 1,400+ videos on YouTube!

Subscribe to get posts via email!
Join 32,000+ readers and get free money management solutions delivered to your inbox! (Link takes you to our email sign-up form)Join our WhatsApp Channel

Explore our products
🔥Join our community of 9000+ users! 🔥- Use our Robo-advisory Tool to create a complete financial plan! More than 3,500 investors and advisors use this! Use the discount code robo25 for 20% off. Plan your retirement (early, normal, before, and after), plus non-recurring financial goals (such as child education) and recurring financial goals (such as holidays and appliance purchases). The tool helps anyone aged 18 to 80 plan for retirement, plus six non-recurring and four recurring financial goals, with a detailed cash flow summary.
- Our Flagship Course! Learn to manage your portfolio like a pro to achieve your goals regardless of market conditions! More than 3,500 investors and advisors are part of our exclusive community! Get clarity on how to plan for your goals and achieve the necessary corpus no matter the market conditions! Watch the first lecture for free! One-time payment! No recurring fees! Lifelong access to videos! Reduce fear, uncertainty and doubt while investing! Learn how to plan for your goals before and after retirement with confidence.
- Join the freefincal investor circle! An exclusive space for investors, advisors, fintech employees and students to access financial planning and insurance tools, mutual fund and stock analysis tools, coding strategies and Excel macros for data extraction. 750+ members are now part of our investor circle.
- Increase your income by getting people to pay for your skills! More than 900 salaried employees, entrepreneurs and financial advisors are part of our exclusive community! Learn how to get people to pay for your skills! Whether you are a professional or small business owner seeking more clients through online visibility, or a salaried individual looking for side or passive income, we will show you how to do it by showcasing your skills and building a community that trusts and pays you. (Watch the 1st lecture for free). One-time payment! No recurring fees! Lifelong access to videos!
- Portfolio Tracker! Track your mutual funds and stock investments with our Google Sheet!
- We also publish monthly screeners for
Our Podcast: Let's Get Rich With Pattu
On Spotify: Let's Get RICH With PATTU! Every single Indian CAN grow their wealth! On Audible: Listen to the Let's Get Rich with Pattu Podcast

Listen to the Let's Get Rich With Pattu podcast on YouTube.
Now watch Let's Get Rich With Pattu தமிழில் (in Tamil)!About The Author

Dr M Pattabiraman giving a lecture
- Dr M. Pattabiraman (PhD) is the founder, managing editor and primary author of freefincal. He is an associate professor at the Indian Institute of Technology, Madras.
- He has over 14 years of experience publishing news analysis, research and financial product development. He has over 28 years of teaching and research experience. He is also a public speaker and keynote presenter.
- He is a patron and co-founder of “Fee-only India,” an organisation promoting unbiased, commission-free, AUM-independent investment advice.
- Connect with him via Twitter(X) LinkedIn YouTube
- Pattabiraman has co-authored three print books.

This book helps you ask the right questions and find the right answers. It also includes nine online calculators to create custom solutions.
(2) Gamechanger: Forget Startups, Join Corporate & Still Live the Rich Life You Want. 

Both the boy and girl versions of "Chinchu Gets a Superpower".
Most investor problems stem from a lack of poor decision-making. We made bad decisions and money mistakes when we started earning, and we spent years undoing them. Why should our children go through the same pain? What is this book about? As parents, what if we had to groom one ability in our children that matters not only for money management and investing but for every aspect of life? My answer: Sound decision-making. So, in this book, we meet Chinchu, who is about to turn 10. The story follows what he wants for his birthday and how his parents plan it, while also teaching him key ideas about decision-making and money management. What readers say! 
Feedback from a young reader after reading Chinchu Gets a Superpower!
Must-read book even for adults! This is something that every parent should teach their kids right from a young age. The importance of money management and decision-making based on their wants and needs. Very nicely written in simple terms. - Arun.
About freefincal & its content policy
Freefincal is a News Media organisation dedicated to providing original analysis, reports, reviews and insights on mutual funds, stocks, investing, retirement and personal finance developments. We do so without conflict of interest and bias. Follow us on Google News. Freefincal serves more than three million readers a year (5 million page views) with articles based only on factual information and detailed analysis by its authors. All statements made will be verified with credible and knowledgeable sources before publication. Freefincal does not publish paid articles, promotions, PR, satire or opinions without data. All opinions will be inferences backed by verifiable, reproducible evidence/data. Contact Information: To get in touch, please use our contact form. (Sponsored posts or paid collaborations will not be entertained.)Our publications
- Your Ultimate Guide to Travel. This is an in-depth exploration of vacation planning, including how to find affordable flights, budget accommodations, and practical travel tips. It also examines the benefits of travelling slowly, both financially and psychologically, with links to relevant web pages and guidance at every step. Get the PDF for Rs 300 (instant download)

- How to profit from content writing: Our ebook is for those interested in getting a side income via content writing. It is available at a 50% discount for Rs. 500 only!