The Ulcer Index is a measure of downside risk in actively managed mutual funds. It is a simple way to find out how stressful it is to hold a fund compared to a benchmark. Investors can make the analysis shown using the tools in the freefincal investor circle (details below).
Context: The standard deviation (volatility) is a measure of deviations from an average (monthly) return. Both positive and negative deviations are accounted for. However, since a positive deviation from an average implies a higher NAV, it is not a ‘bad’ thing. So why penalise it?
So the Ulcer Index is defined similarly to a standard deviation, but is based on drawdowns (fall from a peak) instead of deviations from an average.
Suppose the maximum NAV over 2 weeks is Rs. 15 per unit. If the NAV decreases from this maximum, the Ulcer index value increases, indicating an increase in investor stress. If the NAV increases further, the index decreases, reflecting a decrease in stress!
The Ulcer index is designed in such a way that it penalises downside (fall from the maximum) much more than other ratios. Peter Martin and Byron McCann first published it in their book The Investor’s Guide to Fidelity Funds (1989).
🔥Secure your future with our Robo-advisory tool trusted by over 3,500 investors and advisors. From effortless retirement planning to funding your children’s biggest dreams, turn your financial goals into reality. 🔥
Subscribe for money management solutions via email! (Link takes you to our email sign-up form) Join 32,000+ readers in our community.
👉 New Tool Alert! NaviPlan: A Privacy-Focused Multi-asset Tracker and Goal Planner 👈
Peter Martin describes the index on his page: tangotools. The out-of-print book in PDF form can be found here.
At that time, pretty much everyone thought stomach ulcers were caused by stress. We later came to know that stomach Ulcers are caused by bacteria – a Nobel prize-winning discovery. Of course, the name Ulcer Index stuck!
- The fall from a peak is computed as a percentage change over 90 days. Although this is much longer than the two weeks recommended by Martin, the longer duration cuts out noise and should be good enough for the long-term investor.
- This percentage change is known as a drawdown. We square this drawdown.
- We now compute a rolling 90-day drawdown squared and sum all the data.
- The root mean square of this sum is computed and is known as the Ulcer Index. The Wikipedia Page gives more details. This gives the Ulcer Index for a given period.
- Ulcer Score: We compute this Ulcer index on a rolling 90-day basis for each business day for a benchmark and an active MF, and compute how often the Ulcer index of the fund has been lower than that of the benchmark. This is known as the Ulcer Score, also referred to as the rolling 90-day Ulcer index outperformance consistency.
Now, let us try out the ulcer index with a few mutual funds.
The higher the ulcer index, the lower the downside protection and the higher the investor stress. We require a fund with an ulcer index consistently lower than its benchmark.
Parag Parikh Flexicap Fund vs Nifty 500
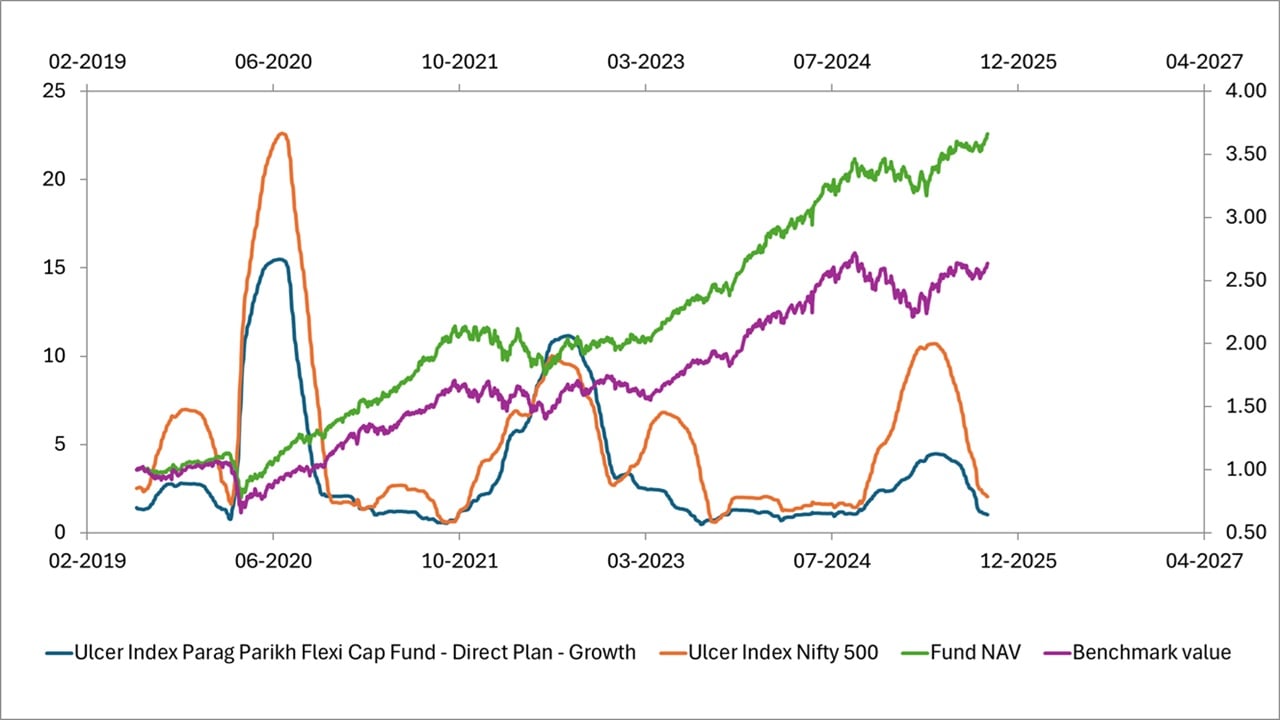
The normalised NAV evolution (the noisy lines) is referenced to the right y-axis. Notice that the blue line (90-day rolling Ulcer Index for the fund) is most of the time significantly lower than the benchmark. This means the investors were shielded from severe drawdowns most of the time.
| Duration (years) | Ulcer Score | UI Fund | UI Benchmark |
| 1 | 100% | 3.19 | 7.05 |
| 2 | 100% | 2.53 | 5.78 |
| 3 | 97% | 2.12 | 5.21 |
| 4 | 78% | 4.46 | 5.76 |
| 5 | 80% | 4.03 | 5.30 |
| 6 | 79% | 5.40 | 7.53 |
| 7 | 83% | 5.04 | 7.16 |
| 8 | 85% | 5.20 | 7.18 |
| 9 | 87% | 4.89 | 6.76 |
| 10 | 86% | 4.88 | 6.69 |
The Ulcer Index of the fund has always been lower than the index. The Ulcer Scores (rolling 90-day Ulcer index outperformance consistency) have been quite high for all durations considered. This is a tremendous performance, and it’s no surprise that this fund is an investor favourite. The fund has also consistently outperformed the index.
As readers know, I am an NFO investor in this fund (a combination of luck and accident, not skill or analytical ability), and a significant portion of my retirement corpus is invested here. This marks 17 years of mutual fund investing: My Journey and lessons learned.
Aditya Birla Sunlife Midcap Fund vs Nifty Midcap 150
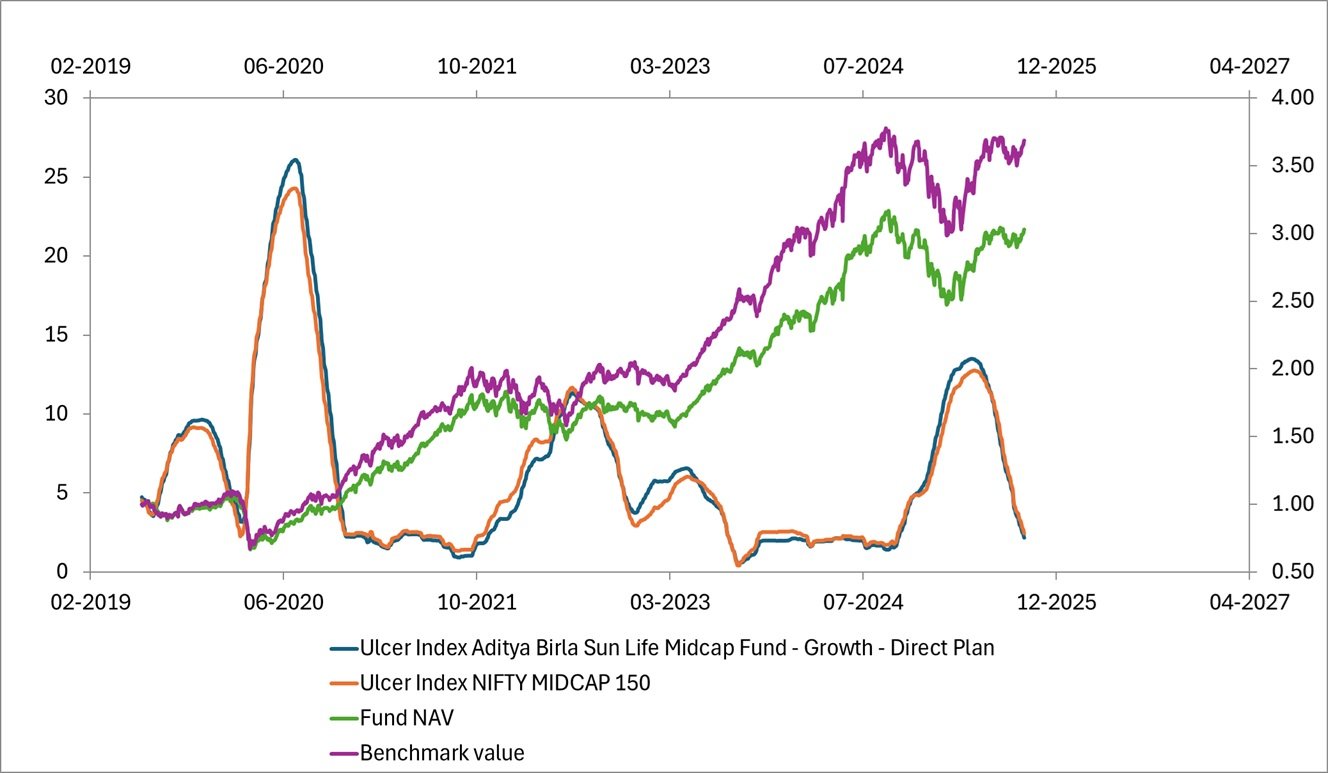
Notice how the fund has typically been as stressful to hold as the index and often more stressful! This shows in its performance!
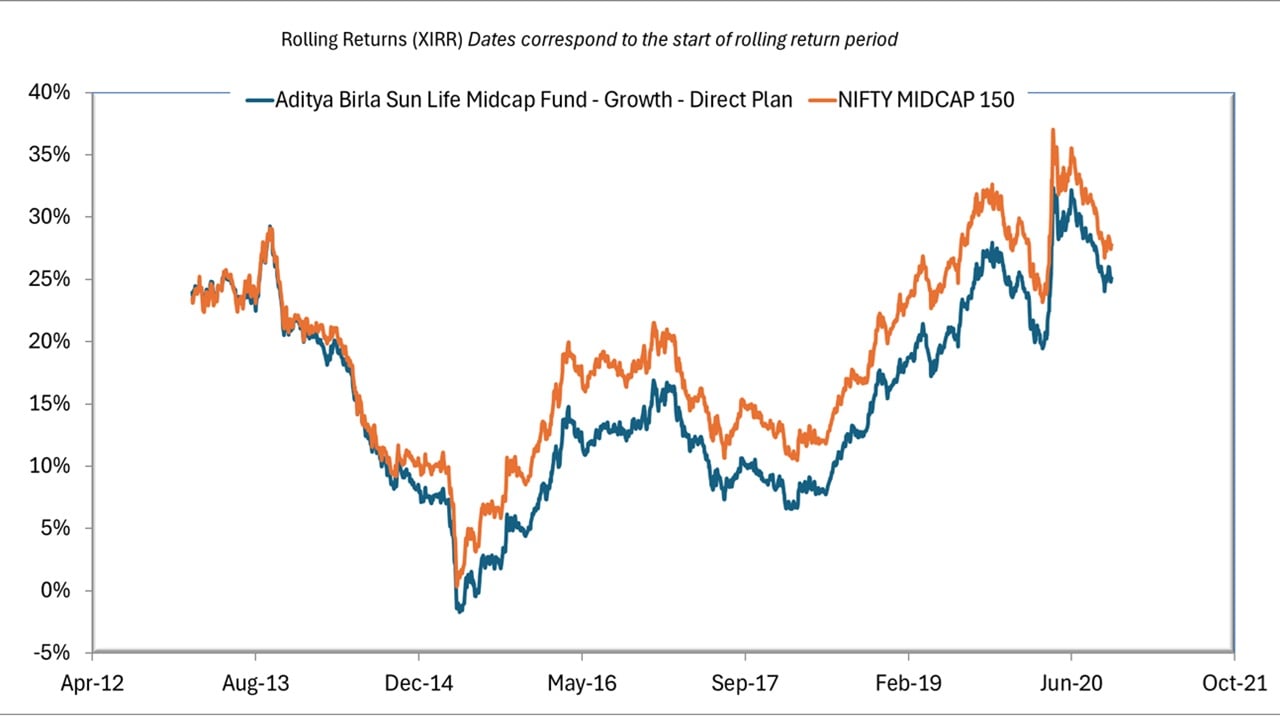
Between January 1, 2013, and Sep 17, 2025, there are 1896 5-year rolling returns. The fund has only outperformed the index 88 out of 1896 times. Thus, the rolling return outperformance consistency over seven years is 88/1896 = 4.64% indicating poor performance (the corresponding score for the Parag Parikh Fund is 100% as of Sep 2025). You can see the Ulcer score for the midcap fund in the screenshot below.
The ulcer index gives you insights into the downside protection history of a fund. This is the most important attribute of an actively managed fund. I strongly believe downside protection is the most reliable source of outperformance – Strange, but true! How mutual funds beat the index! If you prefer actively managed mutual funds, use the Ulcer Index to determine if the extra fee is worth the lower stress and consistent outperformance.
How to compute the Ulcer Index?
The freefincal mutual fund analyser, a part of the freefincal investor circle, has a dedicated Ulcer Index computation page. This is a screenshot. This can be used to generate the graphs and table shown above.

The mutual fund analyser also provides rolling returns comparisons (fund vs. benchmark for lump sum and SIP), rolling volatility, upside and downside capture, XIRR tracking of an investment journey, and much, much more – it is a Swiss army Knife for mutual fund analysis.
The freefincal investor circle is an exclusive space for DIY investors, advisors, fintech employees and students to access 23 financial planning and insurance tools, mutual fund and stock analysis tools, coding strategies and Excel macros for data extraction. 500+ members are now part of our investor circle. You get lifetime access to several unique tools (including new additions and bug fixes), and a discussion forum