This is the third in the series of my finance audits. Focus is again on how I track my personal finance related metrics. This should be helpful for DIY investors and should help them to focus on what and how to measure. I am using the same format and adding a FY25 v/s FY24 section.
- How Sahil plans to achieve financial independence by efficient tracking
- How Sahil achieved a 10X retirement corpus by efficient portfolio tracking
This time I am going directly with the numbers and fewer explanations. Pls read the previous audits to understand the phrases which I have mentioned.
How much do you earn, spend and invest?
- Income growth and investment/expenses
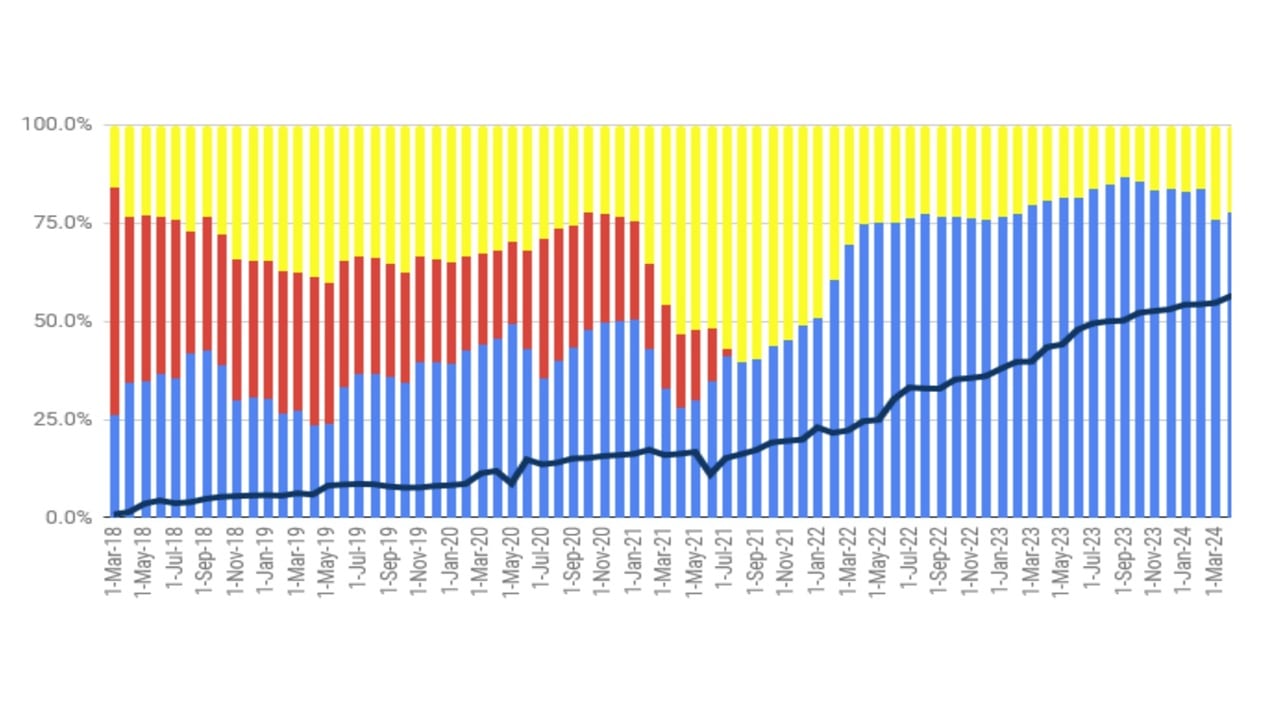
- I am using a dated graph as I don’t want to share the latest numbers, but the following insights are based on real numbers
- Black line shows my 12-month moving average post-tax salary* for any respective month (scale on vertical right axis, redacted to ensure privacy). My salary has grown decently in the last ~5 years and can be seen here in the growth of the black line. Always aim and track if your salary* is increasing at 15%+ rate
- Over the last 12-24 months, I have been able to invest 70-75% (blue) and the remaining 20-25% (yellow) is expenses. No EMIs (red). In the last year, income has continued to increase, albeit at a slower pace, while expenses % are in control
*Pls note that I add EPF contribution (both employer + employee contribution) + NPS employer contribution in salary, although it doesn’t hit my bank account. This overstates by salary and investment ,% but I see no point in not including EPF+NPS contributions
Asset Allocation and Where to Invest?
🔥Secure your future with our Robo-advisory tool trusted by over 3,500 investors and advisors. From effortless retirement planning to funding your children’s biggest dreams, turn your financial goals into reality. 🔥
Subscribe for money management solutions via email! (Link takes you to our email sign-up form) Join 32,000+ readers in our community.
👉 New Tool Alert! NaviPlan: A Privacy-Focused Multi-asset Tracker and Goal Planner 👈
- I don’t maintain a separate emergency fund and have a unified portfolio. It is easier for me to calibrate and measure. Again, one insight here is it becomes extremely difficult to increase the equity exposure as you literally must pour all money in equity irrespective of valuation, where I have some reservations and hence increase in equity% has slowed down. I invested 67% of my cash salary in equity and that resulted only in a 4% increase in equity%
My avg. asset allocation as in FY25 vs avg. asset allocation in FY24 is as follows. I am happy with the increase in equity and reduction in Debt MFs and Liquid Debt
- Savings and FD: ~7% v/s 8% (Target: 5%)
- Debt MFs: ~15% v/s 15% (Target: 10%)
- Debt Illiquid (PPF + EPF + NPS-C/G): ~22% v/s 25% (Target: 15%)
- Equity (MFs+ Stocks+ NPS-E): ~45% v/s 41% (Target: 50%)
- Gold (SGB): ~6% v/s 4% (Target: 10%)
- REIT: ~6% v/s 6% (Target: 10%)
- Here is a bit more information on the instruments used:
- Debt MFs are mix of short term (liquid/arbitrage/UST/Savings) and some medium-term/TMF Debt/Gilt MFs. ~67% is arbitrage plus liquid funds (for rebalancing and emergency use cases), ~13% is short duration and ~19% are TMF+ Gilt funds for locking yields.
- I ensure that the illiquid part of the portfolio i.e. EPF, PPF, NPS doesn’t become too large (>30-35%) because what use is the money if we can’t take it out during times of need. It has been going down now to ~22% v/s ~40% in FY20
- I have NPS Tier-1. Although it is very nominal value but boy, I love NPS T-1 for rebalancing without tax incidence. I started FY24 with 75% equity exposure. I reduced it to 10% E in Jun’24 and further to 0% E in Oct’24 and increased it to 45% E in Mar’25. Call about timing. I made 16% in FY25 in NPS when NPS-E/C/G/A all delivered <8% in FY25 just by exiting and entering at the right time. I wish NPS T-1 was large amount for me but it can’t be unless employer contributes to it.
- Equity portfolio is majorly driven by MFs (85%+), NPS-E (<5%) & Indian stocks (10%+)
- Target amongst the equity portfolio is to have 80-85% India and 15-20% US + China weight. I added China MF this year. I’m at ~10% US + ~10% China and rest India. China was added when their market started recovering in Sep/Oct’24 and when India felt overvalued
- Target in the India portfolio is to have ~10-15% small cap, ~20-25% mid cap and remaining large/giant cap. Currently, I have ~5% small cap and ~21% mid cap, lower than last year. I under own in small and mid-cap but I don’t feel given current valuations there is a case to increase the %age. Of course, SIP continues but lower number and all lump sum goes in large cap
- MFs- PPFAS Flexi cap, Motilal S&P 500, SBI small cap, Invesco mid cap, Edelweiss Balanced advantage and new entry Axis China. Though I also have some N50 and NN50, I use them only for lump sum. No new Indian fund added in last 36 months
- Stocks: 12 stocks compared to 10 last time. Like of ITC, HDFC Bank, Indigo and a few new age companies. Exited Paytm, Titan. For the first time in the last 4 years, mmy stock portfolio has beaten Equity MF portfolio by 2%+. I will be happy if it happens again next year
- New Gold exposure via ETF + Gold MF (stopped SGB as they are trading at a premium). REIT exposure via four listed REITs. I have been buying fixed amount every month. Gold continues to shine and has been a great return this FY, 35 %+. REIT returns have made a comeback (10%+ return), beating fixed income this tim.e
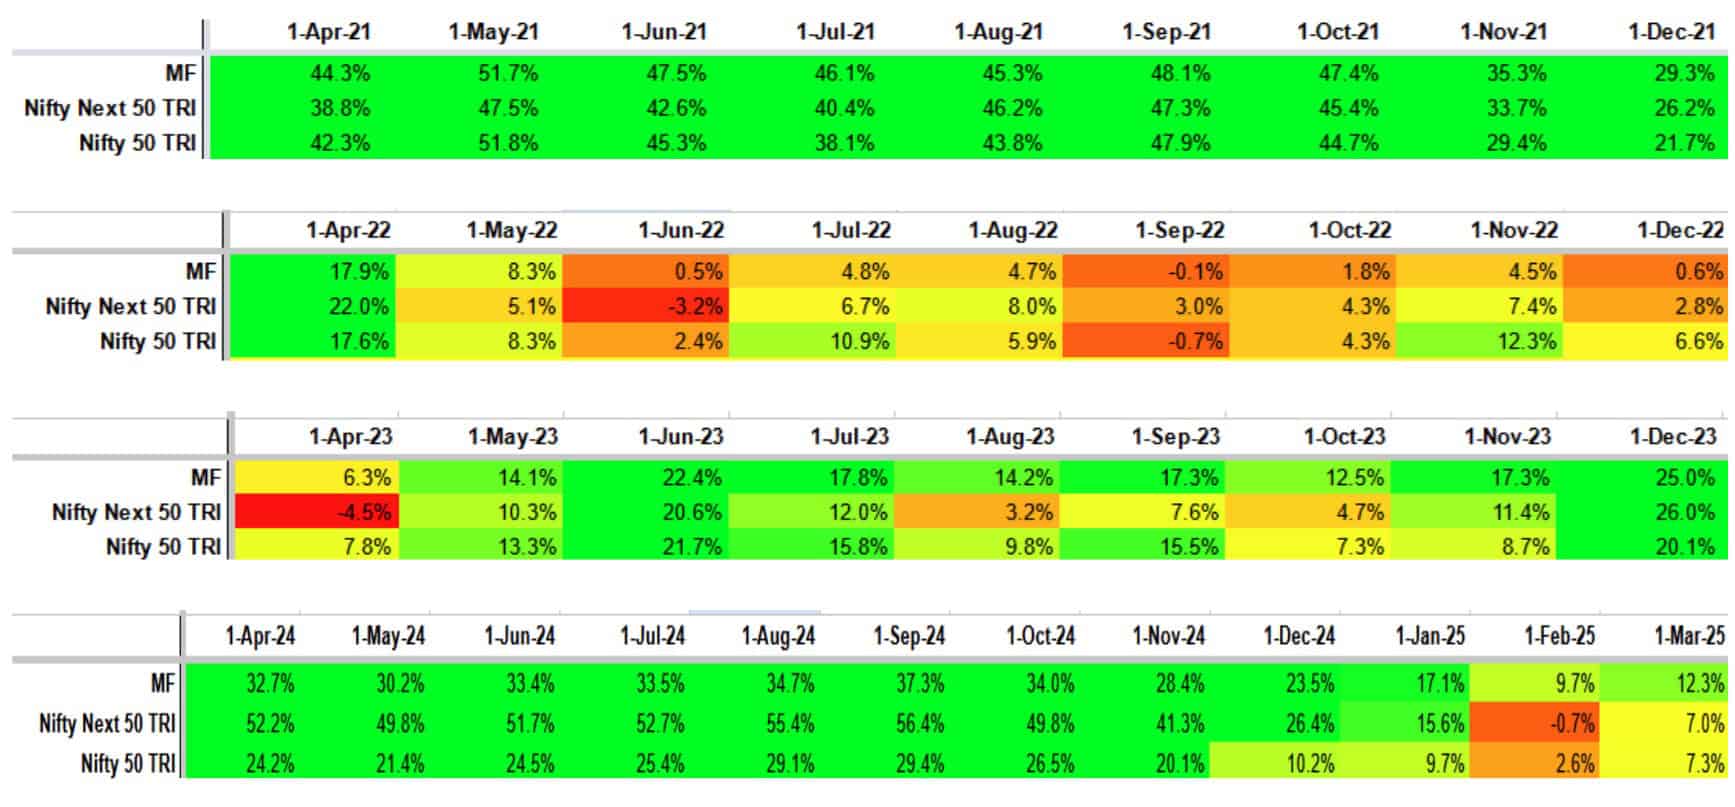
- I measure the standard deviation and rolling returns of each equity MF and as a basket.
- I have beaten N50 TRI and NN50 TRI handsomely by 5% in FY25, way better than last few years. Part of this attribution goes to diversification due to 20% US and China exposure and good returns by selected MFs.
- Just for clarity and explanation on how to read the table below: My Equity MF portfolio gave 12.3% return from Apr-Mar’24 against ~7% return for Nifty50 TRI
- I have beaten N50 TRI and NN50 TRI handsomely by 5% in FY25, way better than last few years. Part of this attribution goes to diversification due to 20% US and China exposure and good returns by selected MFs.
Here’s the rolling 12-month standard deviation of my equity MF for several months against N50 TRI and NN50 TRI.
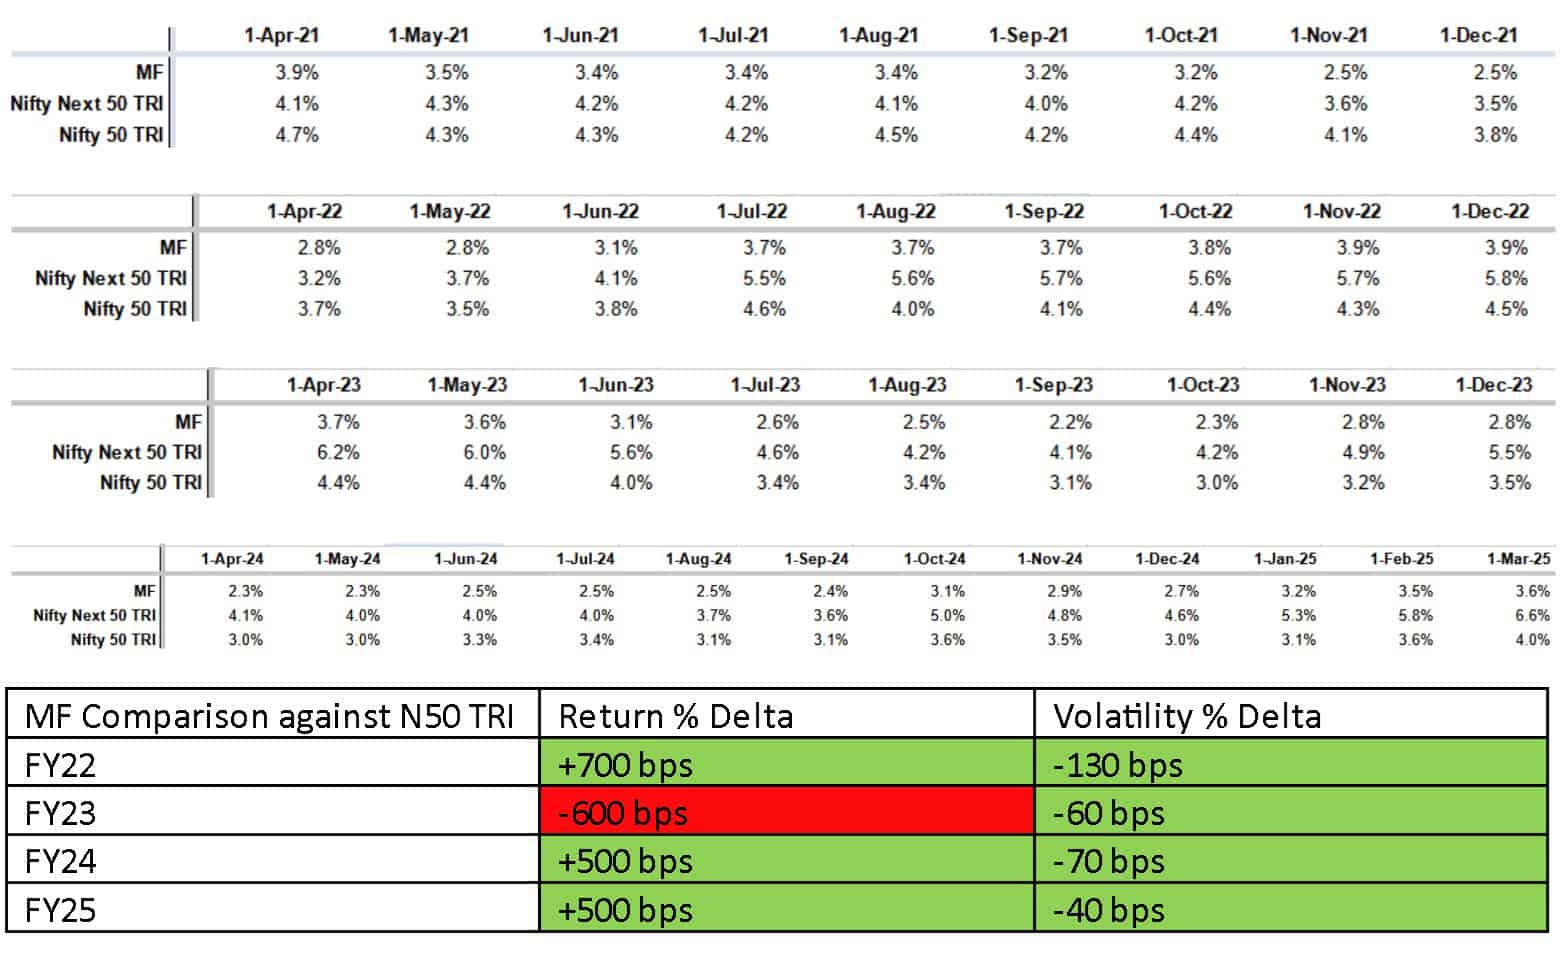
I have been able to beat the indices both in return and volatility in FY25, the same as FY24. This is the holy grail with lower volatility than Nifty, getting a higher return. I am super happy with this result. Mind you, this is tough and not attributed to me but to the performance of chosen MFs. Pls note idea is to get lower volatility and not higher return %. But I will take the higher return rate. 😊
- XIRR as of 1st April 2025
- Equity MF: ~18% (This was ~23% last year)
- Debt MF: ~6.7% (Investing since 2017)
- NPS: ~16% (Investing since 2019)
- Gold: ~25% (Investing since 2020)
- REITs: ~9% (Investing since 2021)
- PF: ~8.2% (Don’t want to tell you my age :D)
- PPF: ~7.4% (Investing since 2015)
- Money saved: No FnO, No trading, No LIC endowment/ULIP plan.
Net-worth (NW) and its measurement
- All this saving, investment, asset allocation and fund selection is fine but how do you bring it all together.
- An example: NW on 1-Nov-01: 100; Nov-21 salary: 10 and expenses: 6; NW on 1-Dec-01: 105. Now, NW has increased by 5 units in 1 month; 4 units (80%) can be attributed to salary savings and the remaining 1 unit (20%) can be attributed to asset income.
- In FY25, my NW has increased by ~40% and about ~70% growth came through salary savings and the remaining ~30% through asset returns (capital gain + interest etc.).
- In FY24, 60% came from salary and 40% from asset returns. FY25 was not a great year for equity and hence this decrease in asset return contribution
- In FY23, 90% growth had come from salary increase and 10% from asset returns.
- As we become older, most of the growth should come from asset returns which happened in FY24 compared to FY23 but not in FY25. Exceptional years like FY24 with amazing equity returns can give a huge jump to net worth but years like FY25 would be more the norm
- Overall, till date, ~76% of my net worth is from human capital (salary-expenses) and rest ~24% if from financial/asset returns. The latter number was <10% 3 years before
- I’ve crossed 10+ times (I don’t want to share the exact number) of annual expenses in terms of my FIRE goal. I want to reach 30- 40x in the next 10 years.
- I have realised that this corpus doesn’t have much value if you don’t own a home. I don’t own and the prices are so exorbitant that either I buy outright and go to negative net worth, or I pay 40-50% of my income as EMIs thereby reducing investment primarily to EPF as I will have not much cash left after expenses. While the above points make me happy, this one makes me feel a little worried.