Last Updated on September 5, 2022 at 4:05 pm
This is a passive fund screener based on tracking error and return difference wrt benchmarks. The screener will help a user evaluate how efficiently an index fund has tracked its underlying benchmark. It will also help a understand how tracking a midcap index or the Nifty 100, 500 is quite different from tracking the Sensex or the Nifty.
The index fund screener is a simple Excel file that can be opened in any spreadsheet utility. It has two sheets. (1) “Returns Index Funds”. This compares the trailing returns over the last 3 months, 6 months, 9 months, one year, 2,3,4,5,6,7,8 years of 31 index funds and their corresponding benchmarks. The return difference (fund return minus index return) is listed. Actual return differences are more intuitive than tracking errors. (2) The tracking error of these 31 index funds over the last 1,2,3,4,5,6,7,8 years are also provided.
The tracking error is simply the standard deviation of fund minus index monthly return differences. The lower the tracking error, the more efficient the fund is in following the index. Unlike returns, tracking error data over multiple durations is hard to find. Also, many investors do not seem to appreciate that the tracking error is dependent on the duration. This screener hopes to change that.
We have already pointed out while selecting index funds, lower expenses do not mean lower tracking errors! With the TER of index funds starting to fluctuate, return differences are a better way to choose or track index funds.
🔥Secure your future with our Robo-advisory tool trusted by over 3,500 investors and advisors. From effortless retirement planning to funding your children’s biggest dreams, turn your financial goals into reality. 🔥
Subscribe for money management solutions via email! (Link takes you to our email sign-up form) Join 32,000+ readers in our community.
👉 New Tool Alert! NaviPlan: A Privacy-Focused Multi-asset Tracker and Goal Planner 👈
How to use the Index fund tracking error screener?
Investors should not look for funds with the lowest tracking error or lowest return difference. That would be too narrow. Instead, they should focus on funds that figure consistently in the top 5 or even top 10 in low tracking error and/or return differences.
Cast a broad net and choose one. Monthly updates of this screener will tell you how the tracking error has worsened after a TER increase.
This is a screenshot of the file. The top and bottom panels represent the two sheets available.
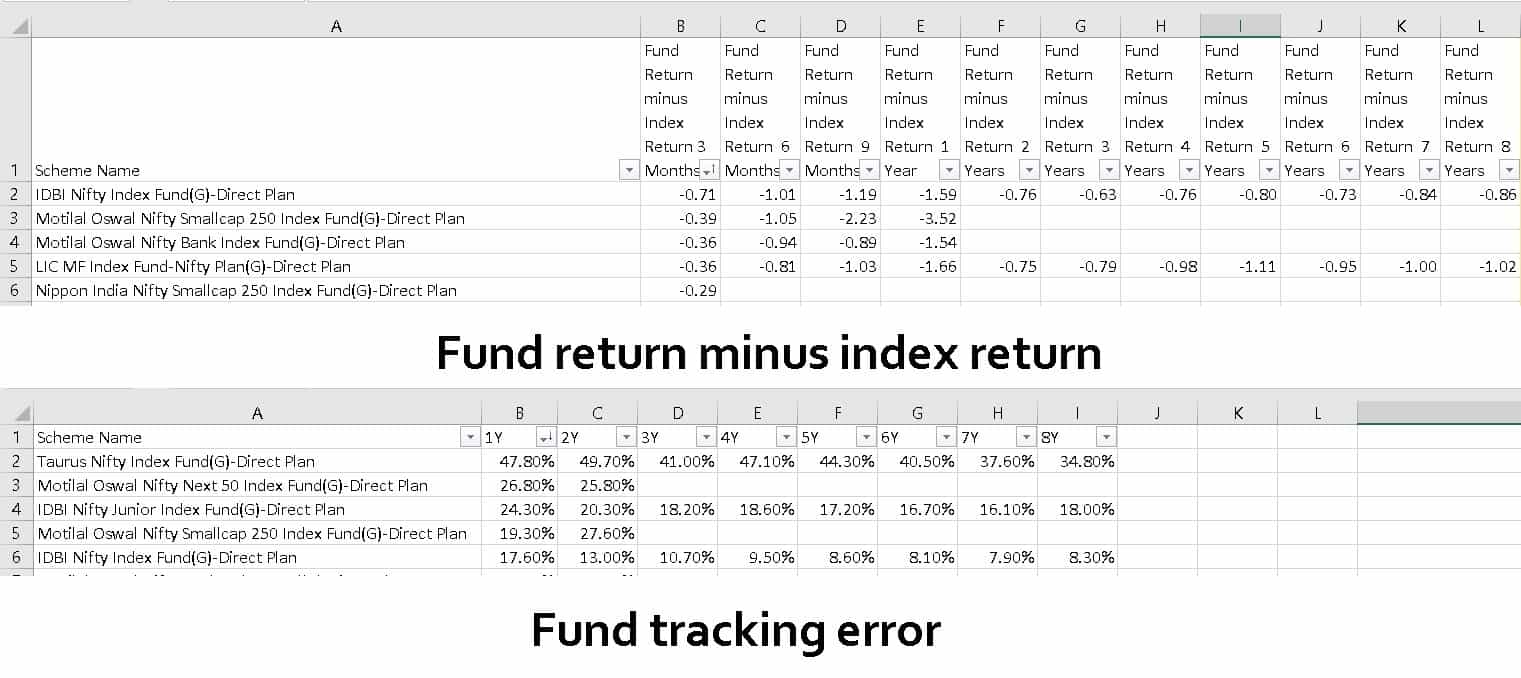
- If this quantity is positive, then the fund has outperformed the benchmark! This is typically a red flag. I would avoid such funds.
- The tracking error is always positive, and you can screen by the lowest tracking error.
- The fund return minus index return requires some attention. Some examples are given below.
| Fund | index | fund return minus index return | Notes |
| 0.80% | 1% | -0.20% | ok |
| -0.80% | -1% | 0.20% | not ok |
| -1.20% | -1% | -0.20% | ok |
| -3% | -1% | -2.00% | not ok |
The user will need to look for funds with a return difference greater than, say, -2% and less than 0%. This can be accomplished with the Excel filter shown below.
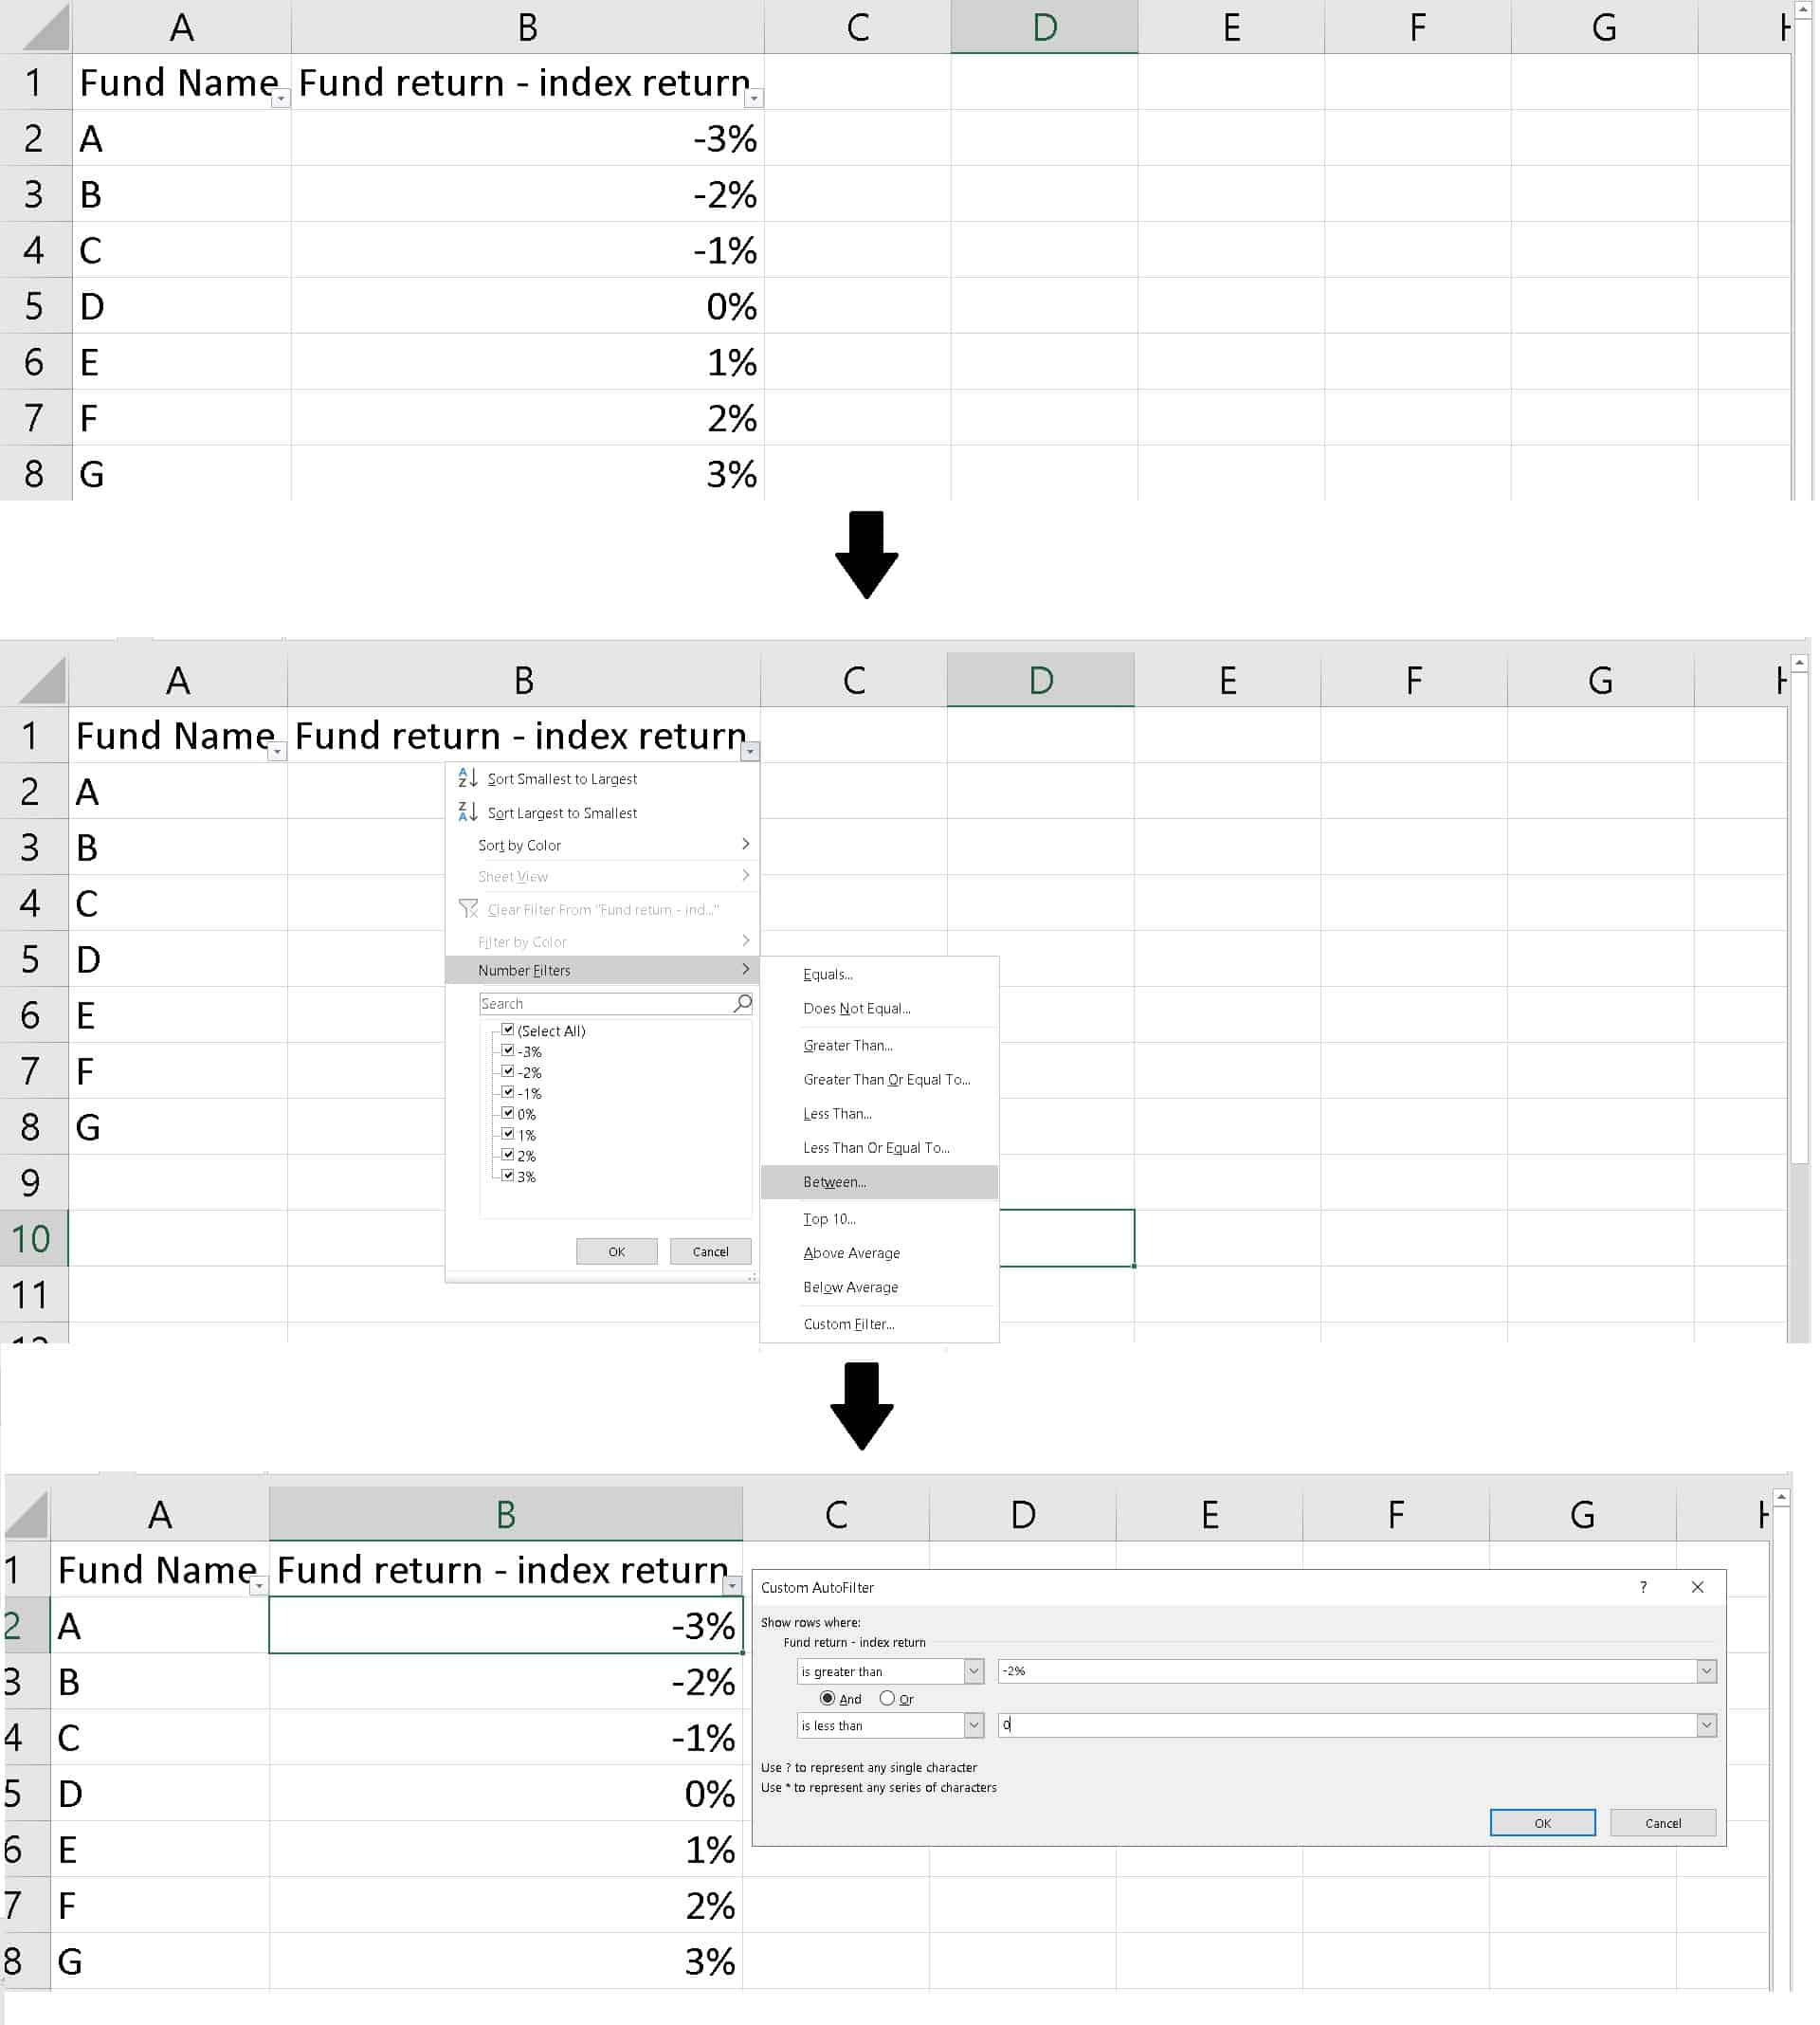
This is summarised in this video
What about ETFs? It is quite easy and tempting to compute the tracking error of ETFs with their NAV. However, this can be seriously misleading because their price and not NAV determine ETF returns.
So ETF tracking should be done with price data and not NAV. Everyone uses NAV for computing returns and tracking error of ETFs, and this is useless for the investor. I am trying to compute trailing returns with price and then compare them with benchmarks. Hopefully, this should be ready soon. I shall try to include the last 3,6,9, 12 months tracking error of ETF price. Longer durations are also possible, but some ETFs declare dividends, and this complicates matters.
Get the Index fund tracking error screener
- This screener costs Rs. 111 (Rs. 100 + Rs.11 transaction fee) and is meant for individual, personal use only. The cost is only for the current month and only for the data in the sheet.
- Inside, you get a discounted link to our two courses: How to get people to pay for your skills (aka earn from skills: 40% discount) and the lectures on goal-based portfolio management (40% discount)
- While freefincal will do its best to publish updated screener sheets each month, it cannot guarantee it.
- The file does not contain any buy or sell recommendations and only has the above-mentioned data.
- Enough care and effort have been put in to weed out errors. However, we cannot guarantee that the sheet is free of error.
- The buyer will have to do their own research with regard to using the information in the spreadsheet. No recommendations or assistance is included in the sheet and will not be provided separately.
- We will not provide any further help or assistance in using the sheet.
- The sheet purchased is for personal use only should not be shared with others privately or publicly. By clicking, you agree to the terms in the important information section above.
Are you living outside India? You can pay via this Paypal link (3 USD) and send a mail to freefincal at Gmail.
Check out our active equity fund and debt fund + hybrid fund screeners!