This is a National Pension Scheme Fund Screener to shortlist consistently performing NPS schemes. You can also spot NPS schemes with a higher return than a benchmark at a lower risk. This is similar in design to the freefincal Equity Mutual Fund Performance Screener.
Inside, you get discounted links to our robo advisory tool and two courses: How to get people to pay for your skills (aka earn from skills) and the lectures on goal-based portfolio management.
We now have 76 NPS schemes in the screener. We will do our best to include additional schemes once some NAV issues are sorted. The benchmarks used are given below.
Benchmarks Used
| Category | Benchmark (index) |
| Alternative Assets | CRISIL Composite Index, CRISIL HYBRID 85:15 |
| Atal Pension Yojana | CRISIL Composite Index, CRISIL HYBRID 85:15 |
| Corporate bond | CRISIL Composite Index, CRISIL HYBRID 85:15 |
| Equity | N200TRI, N50TRI |
| Gilt | IBEX (I-Sec Sovereign Bond Index) |
| Government | CRISIL HYBRID 85:15, IBEX (I-Sec Sovereign Bond Index) |
| Hybrid max 10% -25% equity | CRISIL Composite Index, CRISIL HYBRID 85:15 |
Note: The benchmarks used for non-equity schemes are only notional. They may not be good representatives of the asset class. User discretion is advised.
Use this screener file to quickly find the best-performing NPS schemes that consistently outperform category benchmarks/indices with adequate downside protection (better performance when the index is down) and upside performance (better performance when the index is up).
🔥Secure your future with our Robo-advisory tool trusted by over 3,500 investors and advisors. From effortless retirement planning to funding your children’s biggest dreams, turn your financial goals into reality. 🔥
Subscribe for money management solutions via email! (Link takes you to our email sign-up form) Join 32,000+ readers in our community.
👉 New Tool Alert! NaviPlan: A Privacy-Focused Multi-asset Tracker and Goal Planner 👈
Note: Contrary to popular belief, NPS schemes are not index funds! They have a benchmark and are expected to beat it.
What does this NPS Performance Screener cover?
It gives you three outputs:
- Rolling return outperformance consistency: the NPS scheme/fund returns are compared with category benchmark returns over every possible 1Y,2Y,3Y,4Y, and 5Y period. The higher the outperformance consistency, the better. Suppose 876 fund returns were compared with 876 benchmark returns, and the fund has beaten the benchmark 675 times. The consistency score will be 675/876 ~ 77%.
- Upside performance consistency over every possible 1Y,2Y,3Y,4Y, and 5Y: The higher, the better. A score of 70% means that 7 out of 10 times, the NPS fund performed better than the category benchmark when the benchmark increased. This is a measure of reward.
- Downside performance consistency over every possible 1Y,2Y,3Y,4Y, and 5Y: The higher, the better. A score of 60% means 6 out of 10 times, the NPS fund performed better than the category benchmark when the benchmark was moving down. This is a measure of risk protection.
If you open the screener file, you see column headings like this.
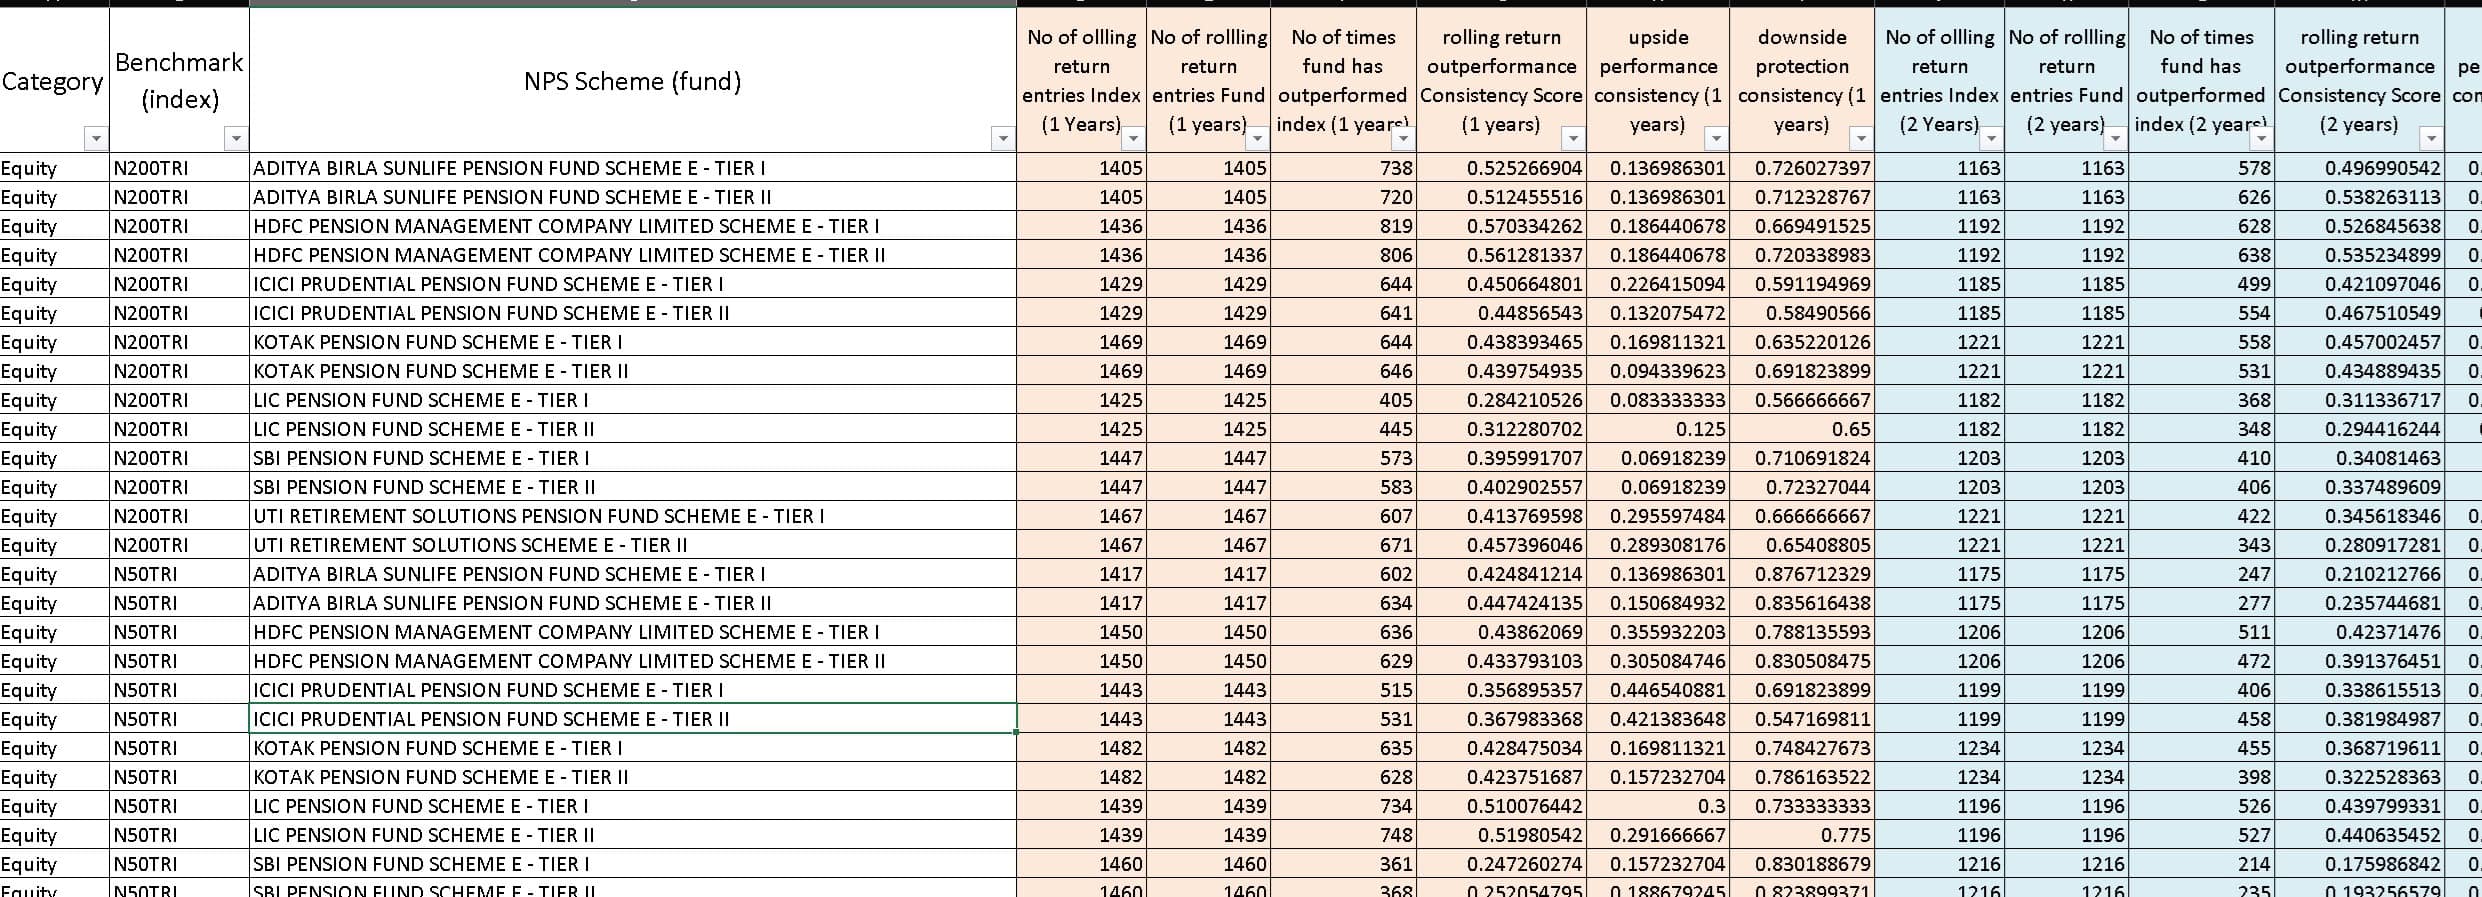
You have the scheme category, benchmark, NPS scheme name, no of 1Y returns of the benchmark(index), no of 1Y returns of the fund, no of times the fund 1Y return is above index 1Y return, the 1Y rolling return consistency; upside performance consistency and downside protection consistency. These columns are repeated for 2Y,3Y,4Y and 5Y.
You can screen by filtering out funds with return outperformance consistency of >=60%, a downside protection consistency of >= 60% and so on. This is only an example. You can apply your criterion for screening.
Screen for NPS schemes with higher than benchmark returns with lower risk
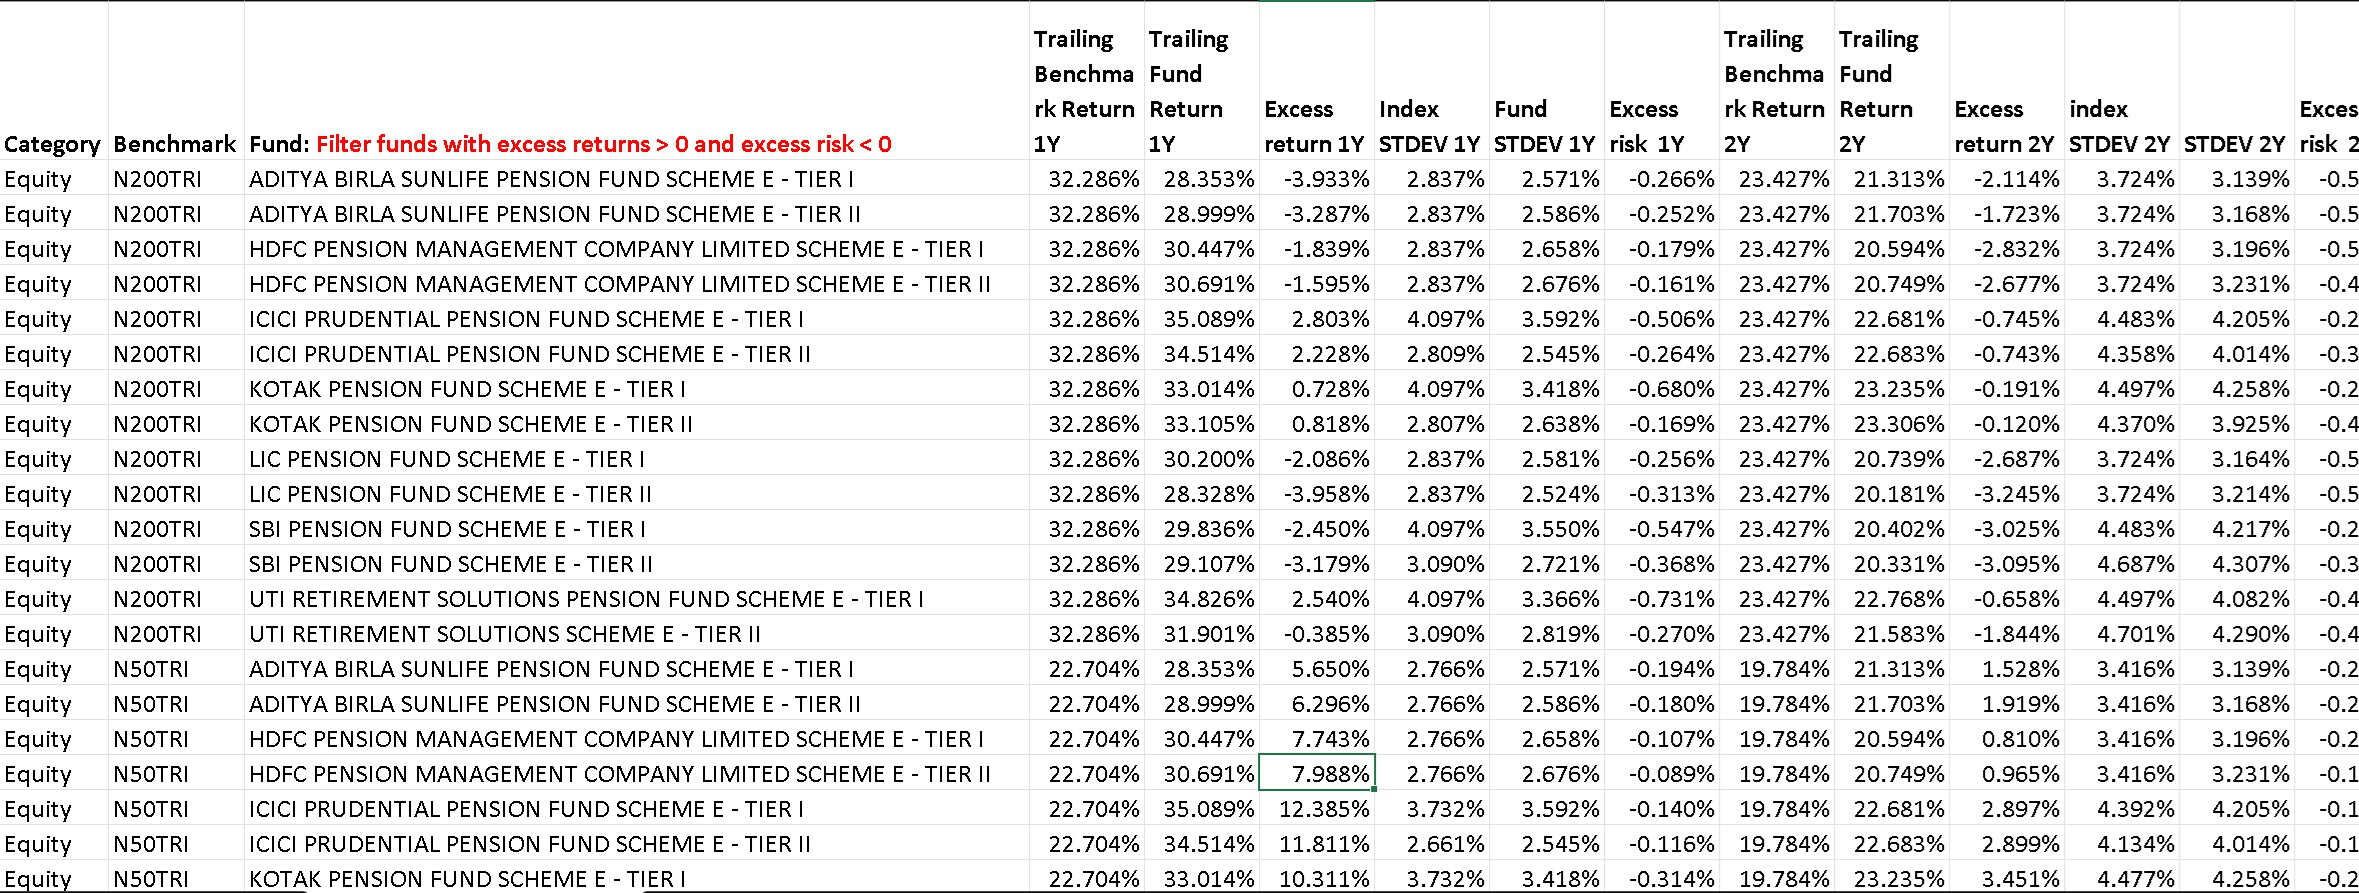
Here, you can screen for funds with excess return > 0 in the last 1,2,3,4,5 year trailing periods. This means the fund return is greater than the index return. You can also add excess risk < 0 filters for the same periods. This means that the fund risk is less than the index risk. Hence, the excess risk is negative.
Take, for example, ICICI PRUDENTIAL PENSION FUND SCHEME E – TIER I
- Trailing Benchmark Return 1Y: 22.704%
- Trailing Fund Return 1Y: 35.089%
- Excess return 1Y: 12.385% (positive excess return is good!)
- Index standard deviation (NAV volatility) 1Y: 3.732%
- Scheme standard deviation 1Y: 3.592%
- Excess risk of the scheme: -0.140% (negative excess risk is good!)
So, over the last 1Y, the NPS scheme has significantly outperformed the index with lower NAV volatility.
The idea here is to find funds that have beaten the index in terms of higher returns (excess return >0) and lower risk (excess risk <0) in the last 1,2,3,4,5 year period. You can relax it to 3/4/5 year periods if you wish.
This is a screenshot of the data.
Reward measure: Rolling returns outperformance consistency.
Rolling returns are a simple estimate of how consistently a fund has outperformed a benchmark.
Take the ICICI PRUDENTIAL PENSION FUND SCHEME E – TIER II as an example. There are 476 five-year rolling returns when compared with Nify 200 TRI. Out of these, the fund beat the benchmark 220 times. So the Rolling returns outperformance consistency = 220/476 = 46.2%. Naturally, the higher the rolling return outperformance consistency, the better.
Reward and Risk Measure: Upside Performance & Downside Capture
Upside performance consistency over every possible 1Y,2Y,3Y,4Y, 5Y: Higher the better. A score of 70% means, 7 out of 10 times, the Fund performed better than the category benchmark when the benchmark increased. This is a measure of reward. It is computed from rolling upside capture data.
Downside performance consistency over every possible 1Y, 2Y, 3Y,4Y, and 5Y. The higher, the better. A score of 60% means 6 out of 10 times, the Fund performed better than the category benchmark when the benchmark was moving down. This is a measure of risk protection. It is computed from rolling downside capture data.
If you wish to understand how these are calculated, please read this: Introduction to Downside and Upside Capture Ratios and proceed to this one, for example. For some funds, a high downside capture consistency will lead to better returns; for some funds, a high upside capture consistency will lead to better returns. The screener can help distinguish between the two types of performers. Recommend reading: What is mutual fund downside protection, and why is it important?
How to use the NPS Performance Screener
There are multiple ways to screen for mutual funds. I will discuss two examples.
Then, method A: Set the 3Y and 5Y rolling return outperformance consistency to be above 60% or 70% or so. That should give you a nice shortlist to choose from. Then, you can visually look for funds with the right downside protection consistency and pick one. Method B: Look for funds above 60% or 70% downside protection consistency over 3Y and 5Y and choose one. Remember, never set narrow filters and do not be too demanding. Wanting to select the fund with the best past performance is plain immaturity. Your screening criteria should yield 5-6 funds at all times. Why should I use this screener? Why can’t I look at trailing returns and screen? Trailing returns are 3Y or 5Y returns calculated with the last business date (3Y and 5Y prior). This is just one data point to consider. Here, we find a lot more to determine consistency.
Excess Risk vs Excess Return Screener: The idea here is to find funds that have beaten the index in terms of higher returns (excess return >0) and lower risk (excess risk <0) in the last 1,2,3,4,5 year period. You can relax it to 3/4/5 year periods if you wish.
Important Information
- This screener costs Rs. 150 and is meant for personal use only.
- Inside, you get a discounted link to our robo advisory tool and two courses: How to get people to pay for your skills (aka earn from skills) and the lectures on goal-based portfolio management.
- The cost is only for the data in the sheet.
- You will get an Excel file with the data. You can enable data filters and screen it as you like. You can upload this file to any spreadsheet software.
- While freefincal will do its best to publish updated screener sheets each month, it cannot guarantee the same.
- The file contains no buy or sell recommendations and only has the abovementioned data.
- Enough care and effort have been put into weeding out errors. However, we cannot guarantee that the sheet is free of error.
- The buyer will have to research using the information in the spreadsheet. No recommendations or assistance are included in the sheet and will not be provided separately.
- We will not provide any further help or assistance in using the sheet.
- The sheet purchased is for personal use and should not be shared privately or publicly. A purchase implies you agree to the terms in the important information section.
Click here to pay Rs. 150 and download (instantly) the latest Freefincal NPS Fund Screener.
Are you living outside India? You can pay via this PayPal link (5 USD) and email us: freefincal at Gmail.