Last Updated on January 10, 2023 at 9:57 pm
Readers may be aware that I often use rolling returns, where anualized return is calculated between two dates and the calculation dates are shifted to the next possible business day. I have developed a rolling downside and upside capture calculator and before publishing it, would like to discuss what they are in simple terms.
A rolling return calculates every possible return between two dates and each month I publish 3Y, 5Y and 7Y returns bet April 20006 to the end of last month. You can refer to last months data here: Monthly mutual fund screeners The idea is to find out how consistent the fund has been in beating its benchmark. This is a rolling reward calculator.
I had earlier published a rolling risk calculator: Evaluating Volatility in Returns – a rolling standard deviation tool. Since I have fallen out of love with the standard deviation and its cousins – the average, alpha, beta, gamma etc. – I wanted to make an alternative rolling risk tool.
The best way to understand upside can downside capture is via an example.
🔥Secure your future with our Robo-advisory tool trusted by over 3,500 investors and advisors. From effortless retirement planning to funding your children’s biggest dreams, turn your financial goals into reality. 🔥
Subscribe for money management solutions via email! (Link takes you to our email sign-up form) Join 32,000+ readers in our community.
👉 New Tool Alert! NaviPlan: A Privacy-Focused Multi-asset Tracker and Goal Planner 👈
Consider the following data set for a fund and index. The monthly NAV and price data is shown along with the monthly return, which is just the absolute difference or the percentage gain or loss.
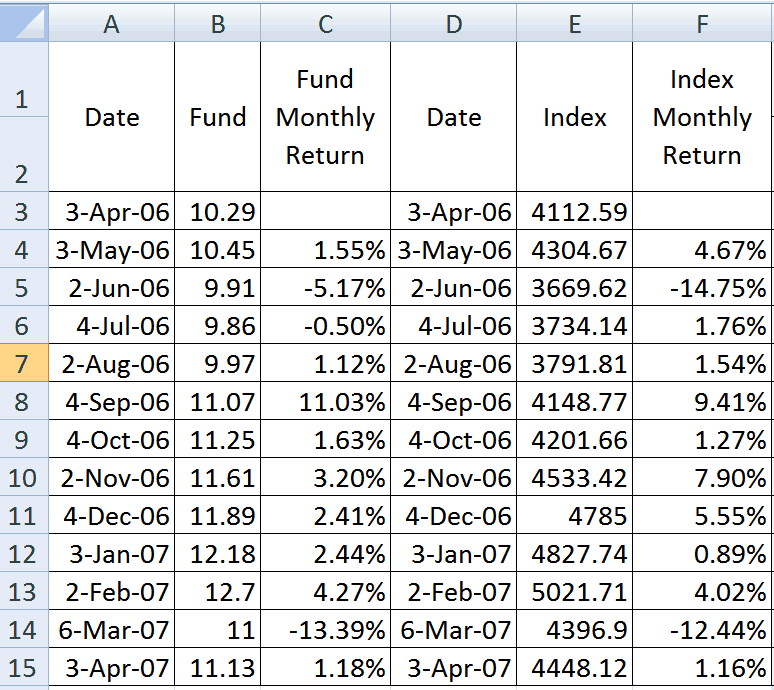
Now I take funds monthly returns can compute annualized return or cagr in the following way
(1+CAGR) = (1+m1) x (1+ m2) x (1+ m3)x…..
From which the CAGR (compounded annualized growth rate or annualized return) = 8.16% as shown above.
With this information in mind, let find tabulate the fund and index monthly returns when the index monthly return was positive (>0) and when it was zero or less (<=0)

First observe the two rightmost columns. There were only two instances when the index monthly returns were <=0. Correspondingly, the fund returns were also negative.
In one instance, the index fell by -14.75% and the fund only -5.17%. In another instance, the index fell by -12.44% and the fund by -13.39%.
Similarly, the two adjacent columns show fund and index returns when index returns were positive.
Suppose I take the fund returns when the index returns were positive and calculate CAGR.

The calculation is identical to the standard CAGR (shown above), but the monthly returns when the index returns were <= 0 are left out.
The 31.68% is known as Upside-CAGR-FUND.
Similarly, we can calculate an Upside-CAGR-Index using only positive index monthly returns.
we can extend the calculation to obtain a Downside-CAGR-Fund and Downside-CAGR-Index.

Upside Capture Ratio
Upside capture ratio = Upside-CAGR-Fund/Upside-CAGR-Index.
It tells you “how much of the index gains the fund captured”. This should be higher than 1 or 100% – whenever the index gives +ve returns, we expect the fund to provide higher +ve returns.
Downside Capture Ratio
Downside capture ratio = Downside-CAGR-Fund/Downside-CAGR-Index.
It tells you “how much of the index losses the fund captured”. This should be less than 1 or 100% – whenever the index falls, we expect the fund to fall lower.
Capture Ratio
Capture Ratio = Upside Capture/Downside Capture. (should be above or close to 1 o 100%).
Now the goal (well, mine anyway) is to look for a consistently low downside capture. This means the fund typically had lesser losses than the index. My experience suggests that it is not possible to expect a consistently high upside capture, but more on this later.
Rolling Upside and Downside Captures
Now imagine these ratios calculated on a rolling basis. For example,
first data set = Apr 2006 to Apr 2007 (for 1Y calculations
second data set = May 2006 to May 2007
third data = June 2006 to June 2007
and so on until we exhaust all the data that we have.
This is an example of a 5Y rolling capture ratio data set for Quantum Long Term Equity vs Nifty 50 (TRI).

This tool is now part of the freefincal investor circle. Join the investor circle! Enjoy a 50% discount for a limited time and pay only Rs. 3000 with discount code circle50. You can get lifetime access to several unique tools, discussion forums, and bug fixes.