Last Updated on August 22, 2022 at 11:27 pm
The market rally over the last few months has seen the Nifty 50 equal weight TR index (N50 EW)surge past the Nifty 50 (N50) TR index. The N50EW one-year return minus the N50 one-year return has reached a level last seen four years ago.
Readers may recall our Dec 2019 that the return difference of Nifty 50 vs Nifty 50 Equal-weight index at an all-time high! This was clear evidence that Nifty (or Sensex) returns were propelled only by a few stocks. Just three months later the market crash destroyed the two-year imbalance among Index stocks.
In the Sensex or Nifty 50 or NIfty 100, just the top few stocks make up the bulk of the portfolio.
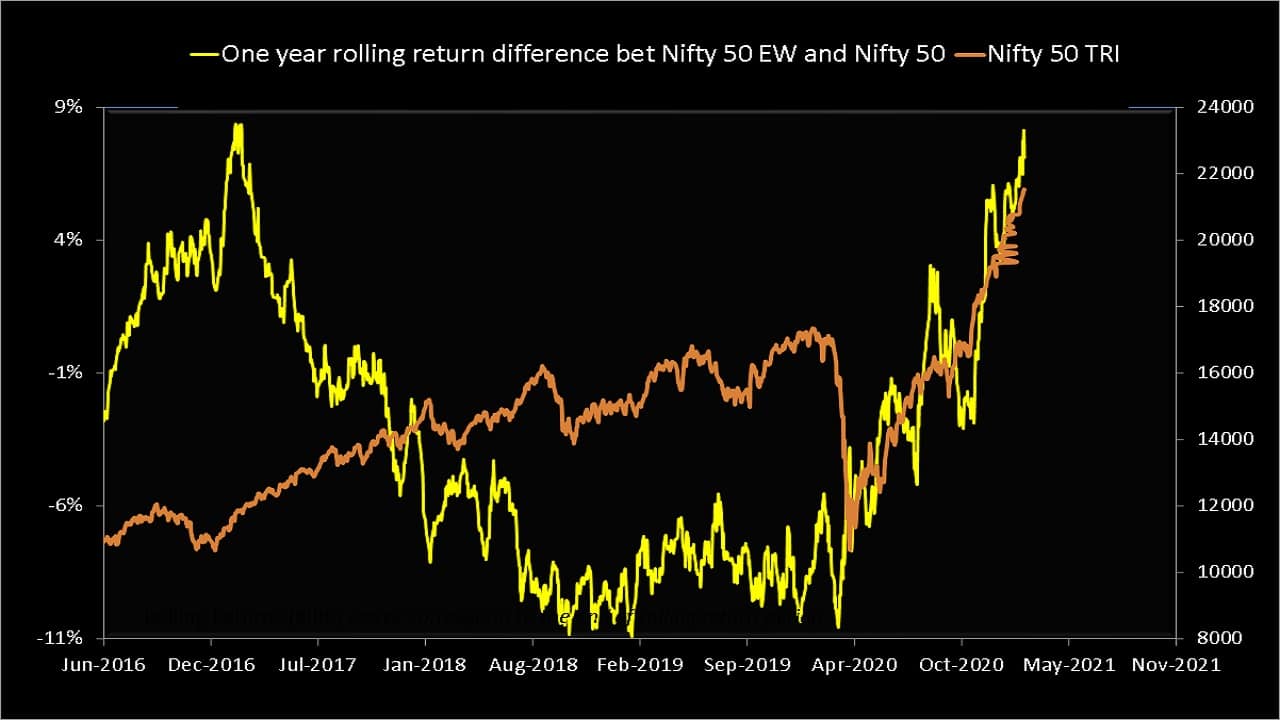
This should help active fund managers and can already be seen in the trail one-year large cap fund returns. A year or two ago this list was dominated by index funds (hence their current popularity). Today, the top ten is dominated by active large cap funds and low AUm index funds. We had pointed this out before: After the market crash, 80% of active large cap funds outperform Nifty, Nifty 100.
🔥Secure your future with our Robo-advisory tool trusted by over 3,500 investors and advisors. From effortless retirement planning to funding your children’s biggest dreams, turn your financial goals into reality. 🔥
Subscribe for money management solutions via email! (Link takes you to our email sign-up form) Join 32,000+ readers in our community.
👉 New Tool Alert! NaviPlan: A Privacy-Focused Multi-asset Tracker and Goal Planner 👈
The situation in the bottom part of the NIfty 50 has also improved but not as much as the top half.
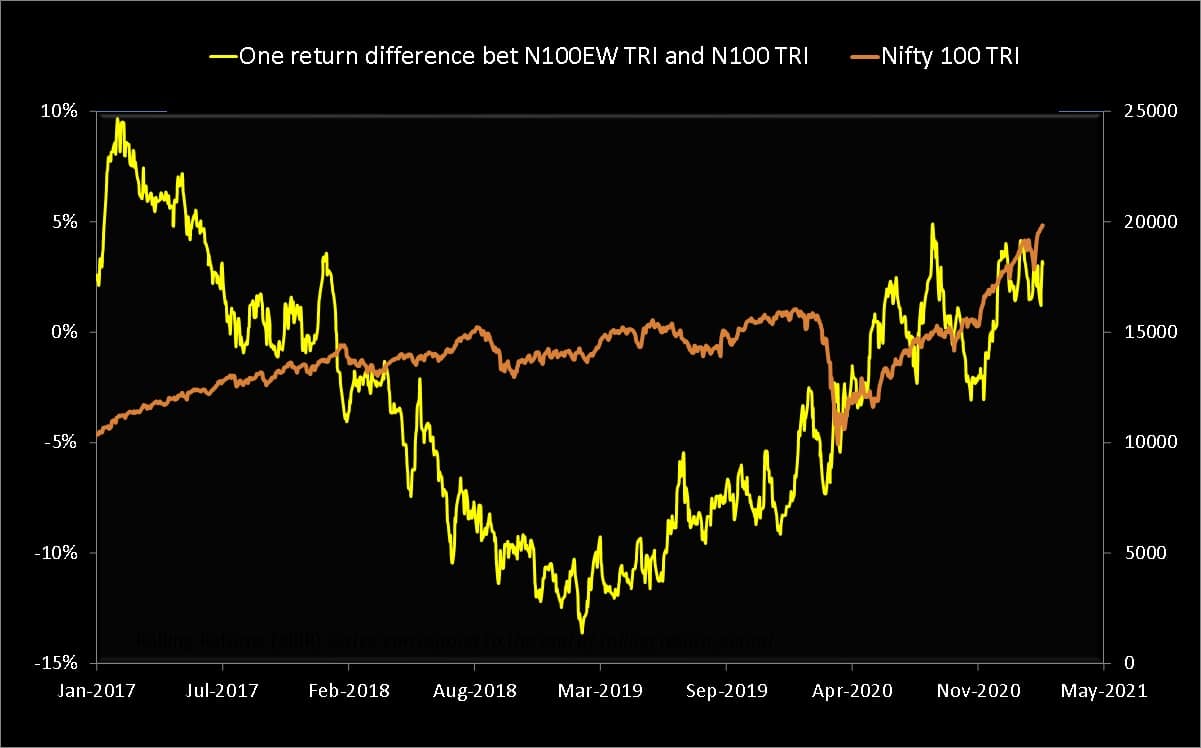
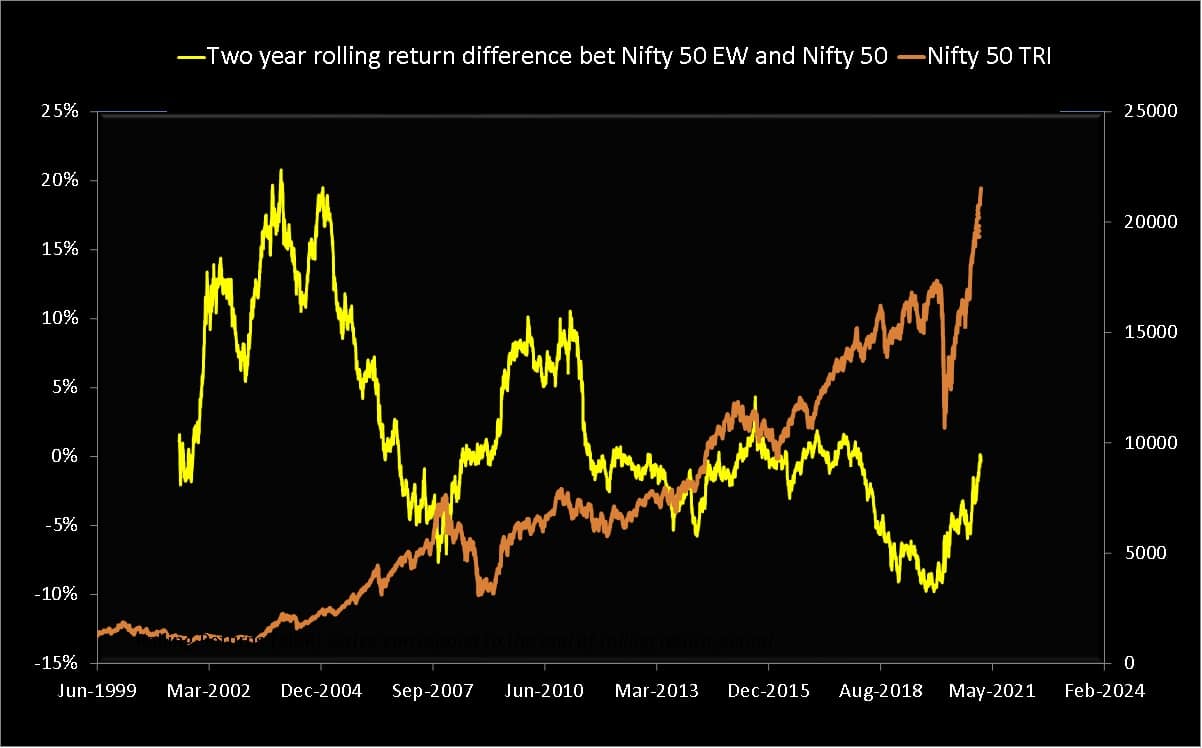
How big a disparity between the top few stocks of the NSE and the rest can be better seen from the 2Y and 3Y return differences.
2Y return difference
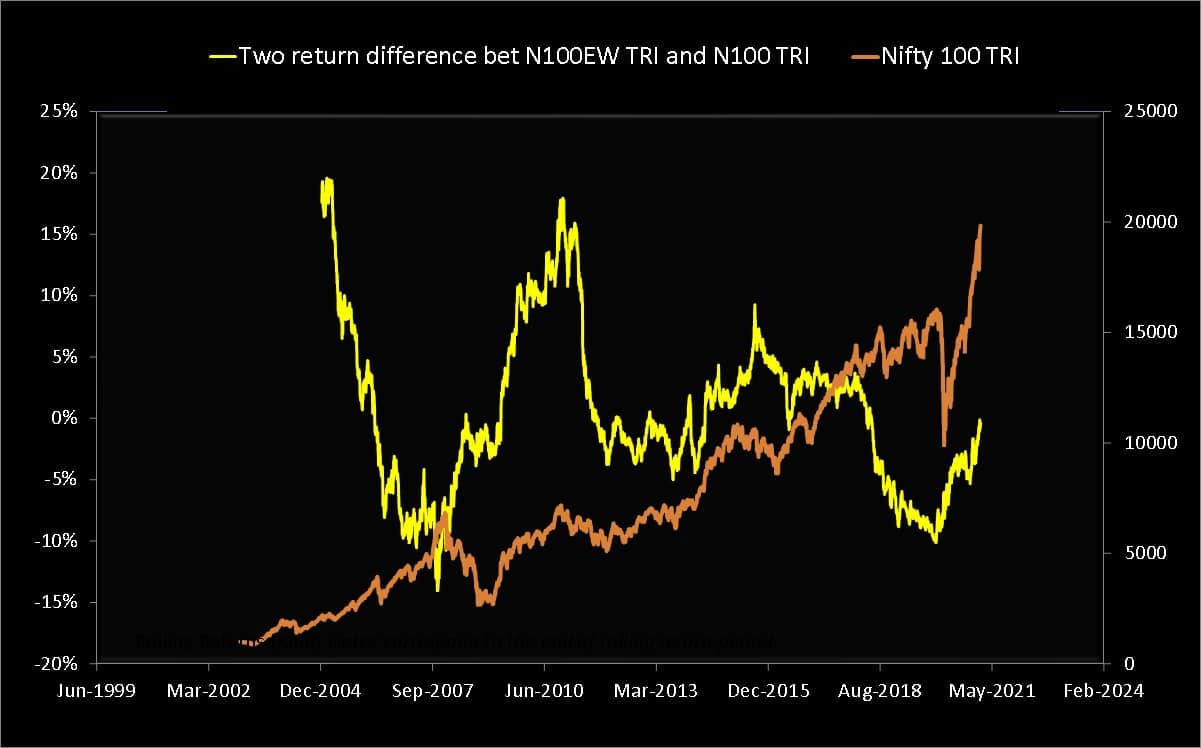
3Y return difference
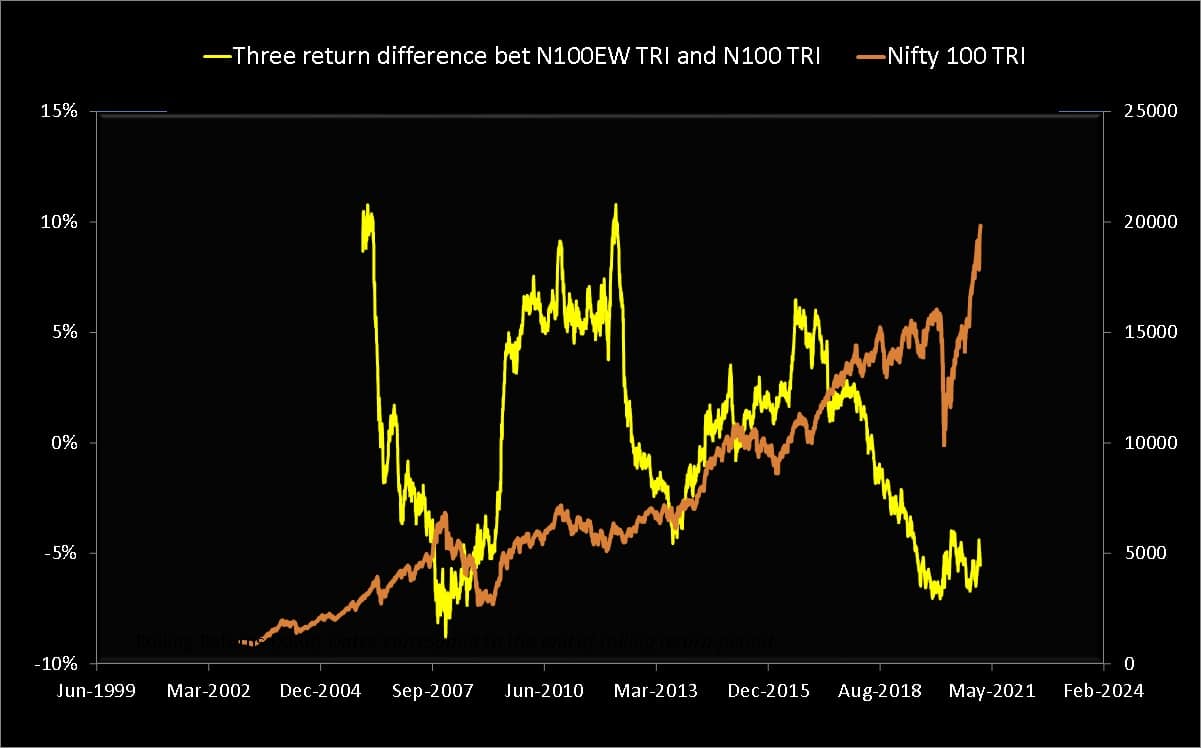
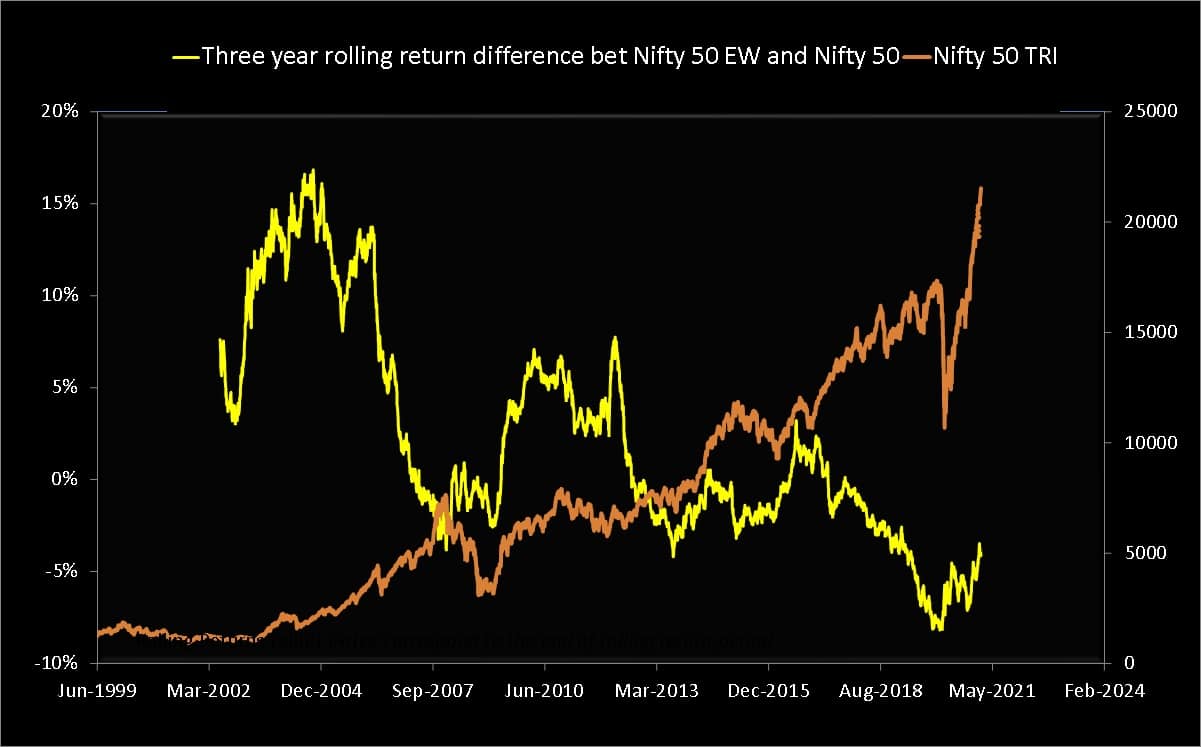
The stocks at the bottom of Nifty 50 or Nifty 100 have quite a bit of catching up to do with respect to 2Y and 3Y returns. So “the market” is not really overvalued from this point of view. It will be interesting to see how active fund managers fare from here on. It is also possible that the imbalance might return!
In this review dated Oct 2019 – Is it time to exit ICICI Value Discovery & Quantum Long Term Equity? – I had pointed out that those who appreciate a value strategy must stick with these funds. Those who did must have benefited from their recent resurgence.