Last Updated on May 12, 2025 at 10:18 am
In the second part of the buying “low” vs buying “high” study, I consider return differences for identical investment amounts. And guess what? The results are most surprising!
For those who have not read the first part, I request that you head over to Equity: Buying “High” vs Buying “Low” and then come back.
Some definitions:
1 Buying low (low-SIP): Buying when index (S&P 500 and Nifty total returns indices) has a value lower than its ten-month average. This is checked only once a month – on the first.
🔥Secure your future with our Robo-advisory tool trusted by over 3,500 investors and advisors. From effortless retirement planning to funding your children’s biggest dreams, turn your financial goals into reality. 🔥
Subscribe for money management solutions via email! (Link takes you to our email sign-up form) Join 32,000+ readers in our community.
👉 New Tool Alert! NaviPlan: A Privacy-Focused Multi-asset Tracker and Goal Planner 👈
2 Buying high (high-SIP): Buying when the index has a value higher than its ten-month average when checked on the first of the month.
3 Buying systematically (normal SIP): Buy on the first of each month.
The investment amounts in the three methods have been kept similar. For example, consider a monthly SIP of Rs. 1000. After eight months the total investment would be Rs. 8000.
If I want to buy low and found that the index went below the 10-month average for the first time in the 9th month, then I will invest the Rs. 8000 saved up + Rs. 1000 = Rs. 9000 in one shot. This ensures all three methods have the same capital.
In the first part, I had not done this. There I found the difference in return between buying low and buying high was quite small. Now I perform this study for every possible 3Y, 5Y, 7Y 10Y, 15Y, 20Y and 25Y periods between
Jan 1900 to Sep 2016 for S & P 500 TRI and
Apr 2000 to Nov 2016 for Nifty TRI.
Two probabilities are considered:
1. The probability of a normal SIP beating a low-SIP.
2. The probability of high-SIP beating a low-SIP.
Results for S & P 500 Total Returns Index
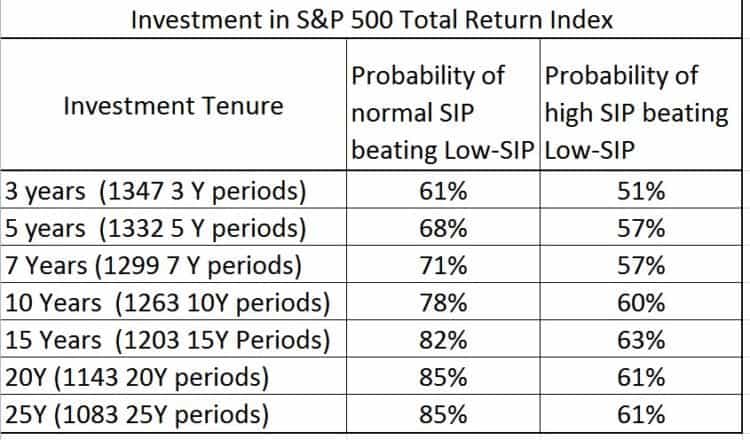
Here 1347 periods implies that the number of 3Y SIP durations were tested between 1900 and 2016.
Results for Nifty Total Returns Index

Compare the very low number of periods available here. Our market is a baby and I am interested in reading too much into these numbers.
For the 7Y period, if you consider the excess return obtained when buying-low did better than a normal-SIP and such excess returns were obtained:
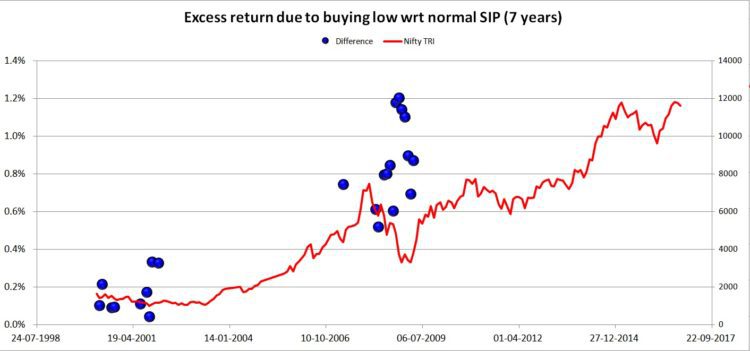
It was only for investments started just after a big crash (dot-com and 2008) and even here the difference is only about ~ 1% or so.
I think the data speaks for itself and no commentary is required. Happy to let my dull and boring SIPs continue
Will say this much: It is one thing to say I will invest on dips or invest during crashes etc. because it appeals to me, and quite another to insist that buying low is the best strategy.
Related Reading
Relevance of the Nifty PE for the long-term investor
Misconceptions about the Nifty PE
Is PB-based investing better than PE-based investing?
Check out Reviews for You Can Be Rich Too
Ten reviews are available for our new book, You Can be Rich with Goal-based investing. Here is a sample:
The only book you need to get your hands on if you are lost in the financial jungle. Do it immediately. Simple, practical, crisp and precise.
The best gift that a young earner can receive.Kudos to the authors. – Karthik.
Check out the other reviews and buy now via Amazon.in for Rs. 399. Or via Infibeam for just Rs. 307. Jeethendra tells me infibeam delivers faster.
The book is also available on Kindle at Amazon.in (Rs. 244.30) or at Amazon.com ($3.36 or Rs. 244.30).
Request to Write a Review
If you have read the book, please review it at Amazon/Flipkart/Infibeam/Google Play. It will make us better writers.