Last Updated on December 18, 2021 at 10:31 pm
The 11th version of the freefincal automated stock analyzer now has an easy-to-understand graphical analysis of the factors that are used to calculate the Altman Z-score. The Z-score is a measure of financial health and in particular, how close the business is to bankruptcy.
If this is your first encounter with the freefincal stock analyzer, you can scroll down to have a look at its full features.
The Z-score is the weighted sum of 5 ratios. The analyzer can be used to study the historical values of these ratios for the last nine financial years. The ratios are referred to as X1, X2, X3, X4, X5
X1: Working Capital / Total Assets
🔥Secure your future with our Robo-advisory tool trusted by over 3,500 investors and advisors. From effortless retirement planning to funding your children’s biggest dreams, turn your financial goals into reality. 🔥
Subscribe for money management solutions via email! (Link takes you to our email sign-up form) Join 32,000+ readers in our community.
👉 New Tool Alert! NaviPlan: A Privacy-Focused Multi-asset Tracker and Goal Planner 👈
Working capital is a measure of liquidity and how much cash the business has to pay current obligations. While the working capital can be temporarily negative, a sustained negative trend over time could indicate trouble.
X2: Retained Earnings / Total Assets
If a company has high retained earnings, it is retaining cash for operations instead of paying out dividends. Higher this ratio, lower the reliance on borrowing and debt.
X3: EBIT / Total Assets
EBIT is the earnings before interest payments and tax. So this is a measure of profitability. Altman refers to this as a “true measure of productivity”.
X4: Market Value (cap) of Equity / Total Liabilities
Any dramatic drop in this ratio is a sign of poor financial health.
X5: Net Sales/ Total Assets
Also known as the capital turnover ratio, this is a measure of ability to generate sales and also steer clear of competition.
The Altman Z-score is measured by multiplying each of these ratios by a factor and adding them up.
Z (1968 version) = 1.2X1 + 1.4X2 + 3.3X3 + 0.6X4 + 1.0X5
In 1995 Altman modified this to
Z’ = 3.25 + 6.56X1 + 3.26X2 + 6.72X3 + 1.05X4
for emerging markets.
For companies like banks and airlines which do not manufacture, he proposed that 3.25 in Z’ be dropped.
These numbers were determined after an extensive back-testing analysis of companies which declared bankruptcy in 1968 first. Later studies have shown that the formula is still valid.
While I am not clear about whether the Z-score itself can be applied for Indian business, the 5 ratios that make the score can prove insightful when studied over time. This is the aim of the freefincal stock analyser.
Here is a screenshot the Z-score page for Colgate.
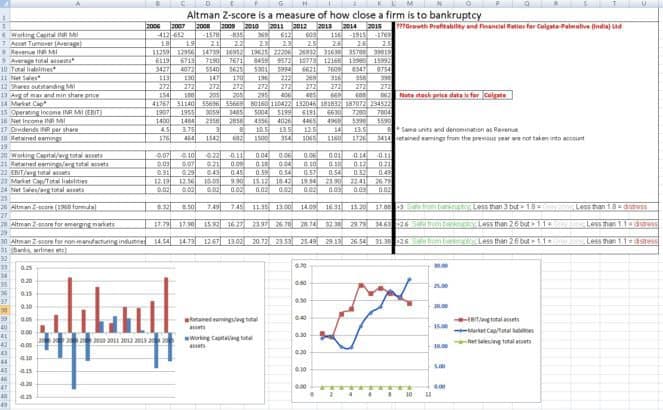
The individual ratios can be visually studied in this sheet.
Other Features
The automated stock analysis sheet
- pulls financials from morningstar and analyzes them
- pulls adjusted stock price history from money control, and
- calculates intrinsic value six different ways!
It also pulls annual (standalone/consolidated) and quarterly financials from Value Research online.
Valuation models available:
1) Price Multiple Model
2) Sustainable Growth Rate
3) Book Value Growth Rate (Buffett’s approach to valuation)
4) Discounted Cash Flow (DCF)
6) Graham formula and Graham number
7) Piotroski Score for the last 9 financial years
8) Earnings Growth Estimate.
9) Automated Return on Equity Analysis with the Dupont Formula
Download version 14th of the freefincal stock analyzer June 16th, 2019 <== latest!