Last Updated on September 16, 2025 at 4:38 pm
This ETF screener is based on tracking errors and differences (ETF return minus index return). It will help users evaluate how efficiently an ETF has tracked its underlying benchmark.
The tracking error is the ETF’s standard deviation minus the index’s monthly return differences. The lower the tracking error, the more efficient the ETF is in following the index. Unlike returns, tracking error data over multiple durations is hard to find. Also, many investors do not seem to appreciate that the tracking error depends on the duration. This screener hopes to change that.
In an index fund, there is only the NAV. In an ETF, the units are typically traded during market hours like a stock, with an associated price determined by supply and demand. An AMC-appointed intermediary is supposed to keep the price close to the NAV, but often this does not happen.
In an index fund, the fund manager must ensure the NAV tracks the benchmark. In an ETF, not only should the NAV track the benchmark, but the price also should (or equivalently, track the NAV).
🔥Secure your future with our Robo-advisory tool trusted by over 3,500 investors and advisors. From effortless retirement planning to funding your children’s biggest dreams, turn your financial goals into reality. 🔥
Subscribe for money management solutions via email! (Link takes you to our email sign-up form) Join 32,000+ readers in our community.
👉 New Tool Alert! NaviPlan: A Privacy-Focused Multi-asset Tracker and Goal Planner 👈
ETF tracking errors are usually reported using the NAV. The tracking error or tracking difference information does not tell us if the price closely follows the NAV. We will have to guess this by looking at trading volumes. This screener will help change that.
As we have repeatedly shown, tracking NAV-based tracking errors seriously is a big mistake. For example, Conventional ETF tracking errors can be misleading; here is how to correct them. This link also has examples of how the tracking error is computed.
We buy and sell ETF units at market price; therefore, the price should be used to compute tracking errors and tracking differences. An ETF with a low NAV-based tracking error can have a high price-based tracking error. This means that the ETF price is not tracking the NAV properly.
We can instantly know how efficiently the ETF tracks the benchmark by measuring the tracking error with the ETF price. Or, in other words, how efficient the AMC-appointed intermediary is in arbitrating out the price differences. An efficient intermediary can help minimise price-nav deviations even in low-AUM ETFs. Also, a high AUM does not mean the ETF’s price-NAV deviations are automatically low.
Many investors believe ETFs are better than index funds because of their low expense ratios. This is incorrect. Only an ETF with low price-NAV deviations can match up to an index fund. The price-based tracking error will help us search for such ETFs. See ETFs vs Index Funds: Stop assuming lower expenses equals higher returns!
This screener can be used to short-list “good ETFs” using the price-based tracking error.
This is a screenshot of the freefincal ETF tracking error screener
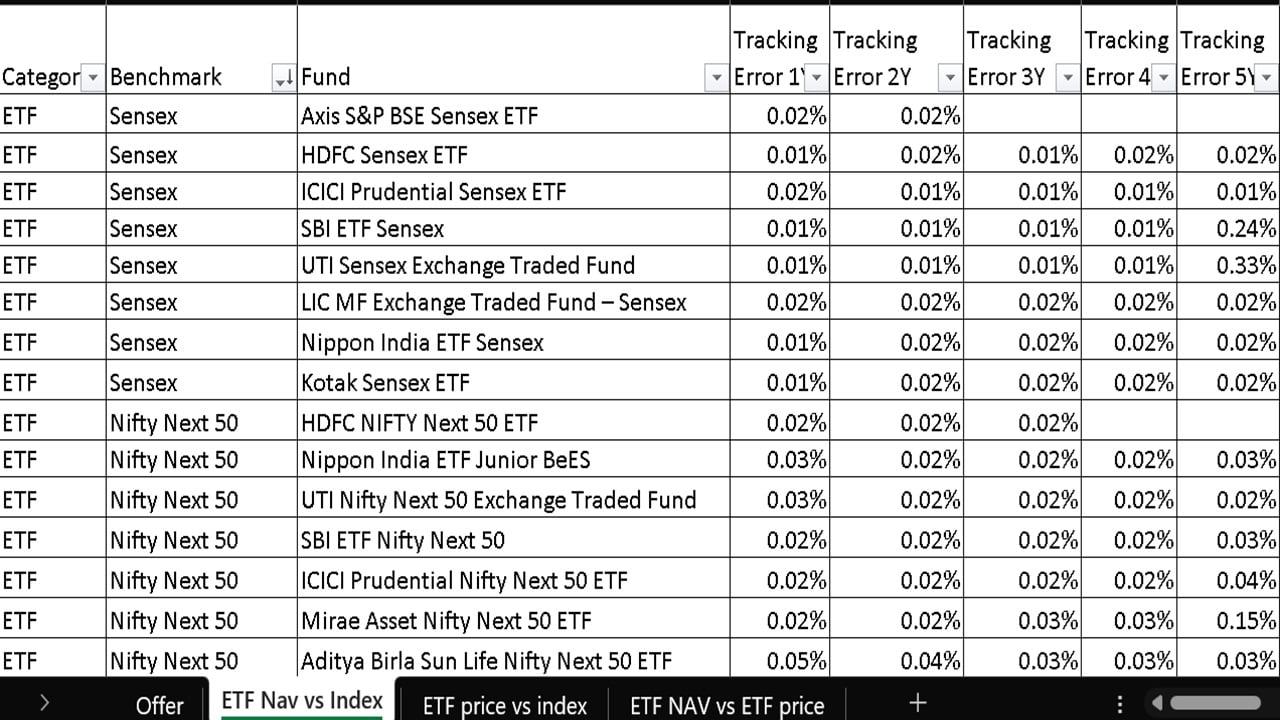
Features of the ETF tracking error screener
- 76 ETFs are featured, covering Nifty 50, Nifty 100, Sensex, Nifty Next 50, gold, Nifty IT, Nifty Healthcare, Nifty Bank, and Nifty Consumption. Depending on user interests, additional ETFs will be added in the coming months.
- Presented in a simple Excel file that can be opened in any spreadsheet utility with three sheets.
- Sheet 1: ETF Nav vs Index: The ETF tracking errors and returns (based on NAV) and benchmarks over the last 1,2,3,4, and 5 years are presented with the return difference: ETF NAV returns minus benchmark.
- Sheet 2: ETF Price vs Index: The ETF tracking errors and returns (based on price) and benchmarks over the last 1,2,3,,4 and 5 years are presented with the return difference: ETF price return minus benchmark. A screenshot of the two sheets is shown below.
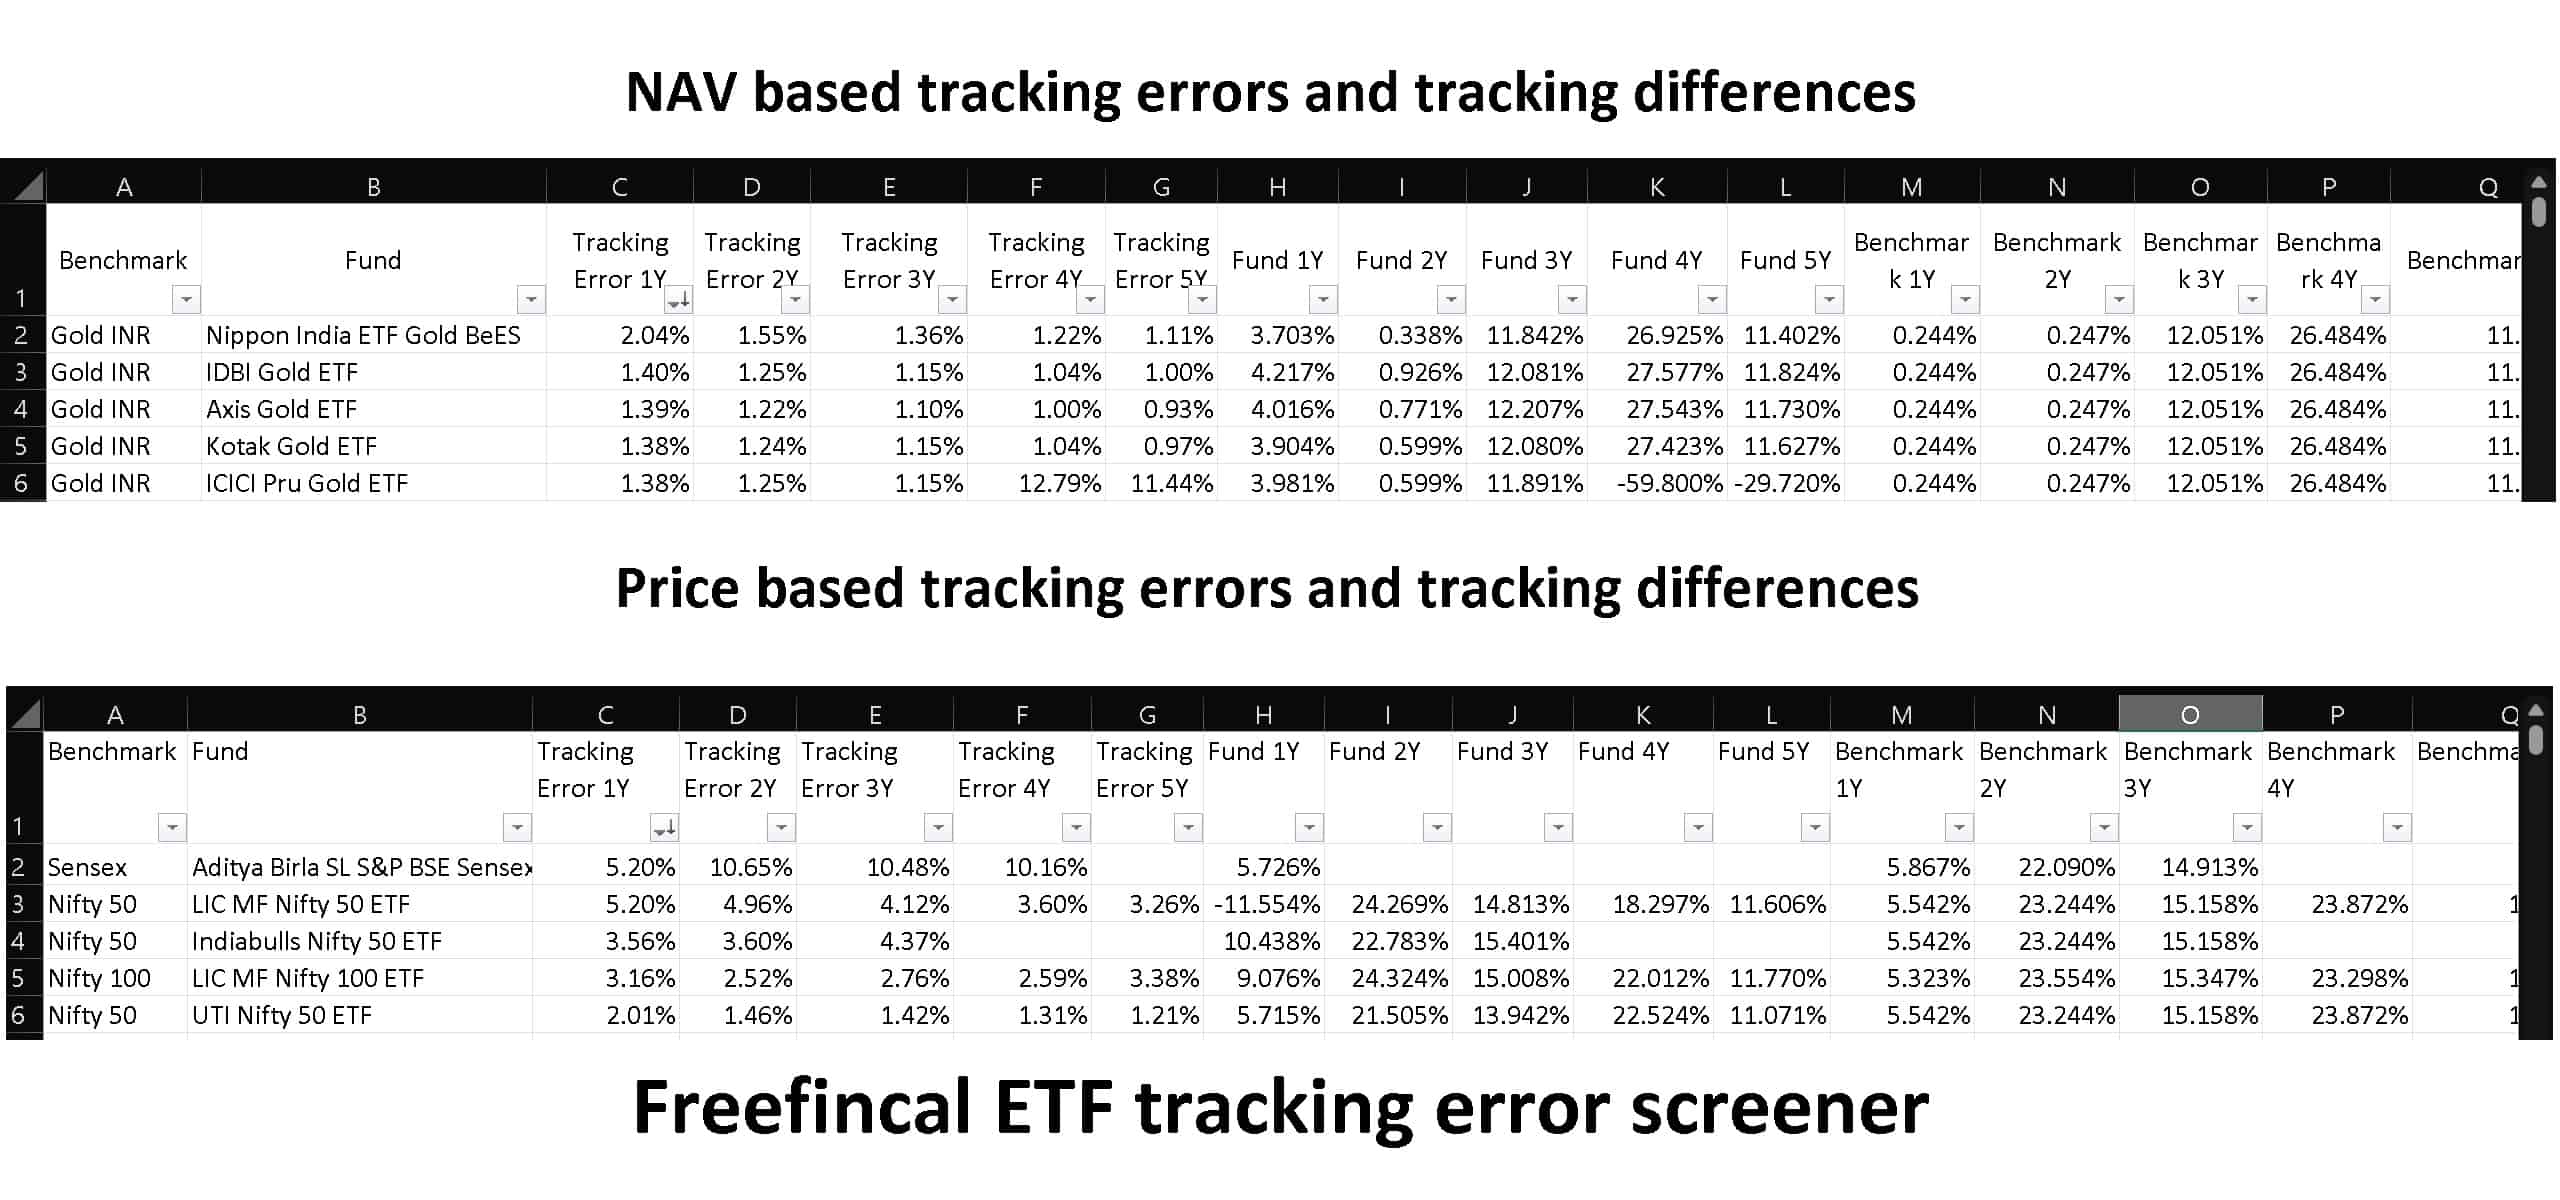
- Sheet 3: ETF NAV vs ETF Price: A tracking error between the NAV and price is defined and listed over the last 1, 2, 3, 4, and 5 years. The return difference: ETF NAV return minus ETF price return is also provided. This is provided on an experimental basis. The first sheets alone should suffice for efficient screening.
- Low cost; No subscription is necessary! Each month’s screener costs Rs. 200, and users can purchase it as needed.
- Inside, you get discounted links to our two courses: How to get people to pay for your skills (aka earn from skills) and the lectures on goal-based portfolio management.
How do I use the ETF tracking error screener?
- Look for ETFs with consistently low price-based and NAV-based tracking errors. There should not be too much difference between the two quantities.
- Also, look for ETFs with consistently low tracking differences. That is, ETF price return minus index return should be small, and ETF NAV return minus index should also be small.
- Consistent here means over the last 1,2,3,4 and 5 years.
- Note: price-based tracking return differences can be positive or negative. As long as they are small, it is ‘ok’.
- If a price-based tracking error or ETF price return minus index return is abnormally high, it could mean the price has shot up or down by a huge amount. Check at Value Research how often such deviations occur and how long they last. Any deviation that takes too long to correct is a red flag. Frequent deviations are also a red flag.
- Do not look for the “best ETF.” Instead, cast a wide net and be satisfied with reasonably consistent performance.
Get the ETF tracking error screener!
- This screener costs Rs. 200 and is meant for personal use only. The cost is only for the current month; the data is in the sheet.
- Inside, you get discounted links to our two courses: How to get people to pay for your skills (aka earn from skills) and the lectures on goal-based portfolio management.
- While freefincal will do its best to publish updated screener sheets each month, it cannot guarantee it.
- The file contains no buy or sell recommendations and only has the abovementioned data.
- Enough care and effort have been put into weeding out errors. However, we cannot guarantee that the sheet is error-free.
- The buyer will have to research using the information in the spreadsheet. No recommendations or assistance are included in the sheet and will not be provided separately.
- We will not provide any further help or assistance in using the sheet.
- The sheet purchased is for personal use and should not be shared privately or publicly.
- You agree to these terms and conditions by clicking the link below.
Click here to pay Rs. 200 and download (instantly) the latest Freefincal ETF Tracking Error Screener.
Are you living outside India? Use this PayPal link to pay 5 USD for the ETF screener.
Check out our active equity fund, debt fund, and hybrid fund screeners!