Last Updated on September 5, 2022 at 4:12 pm
In this article, we explain why conventional ways of measuring ETF tracking errors can be misleading and present an alternative.
The efficiency of a passive fund (index fund or ETF) is measured by the tracking error or tracking difference. The tracking difference is simply the fund return minus benchmark return. This must be a small negative number. Negative because expenses will always reduce returns. If the difference is positive, then it means the fund has beat the benchmark. This can happen only if the tracking is not efficient. See: Six Index Funds “Outperform” their benchmarks in the last year! Also, see Ten Index funds with the largest return deviation over the past year.
To understand how tracking error is measured, we must understand how a standard deviation is measured. Consider a set of fund monthly returns. We first find out the average monthly return. Then we find out how much individual monthly returns have deviated from the average. A standard deviation is the “average” of such individual deviations. Instead of a conventional average which can be positive or negative, the standard deviation is always defined to be positive. To do this, the square of the individual deviation is used.
Let us see how this is done with an example. Take three numbers 1,3,5.
🔥Secure your future with our Robo-advisory tool trusted by over 3,500 investors and advisors. From effortless retirement planning to funding your children’s biggest dreams, turn your financial goals into reality. 🔥
Subscribe for money management solutions via email! (Link takes you to our email sign-up form) Join 32,000+ readers in our community.
👉 New Tool Alert! NaviPlan: A Privacy-Focused Multi-asset Tracker and Goal Planner 👈
The average is 3.
The deviation of each number from the average is
(1-3) ; (3-3); (5-3) or -2,0,2
Now take the square of each deviation
(-2)^2, 0^2, 2^2 or 4,0,4
The average of the deviation squared is (4+0+4)/3
The standard deviation is the square root of (4+0+4)/3
The actual definition used is (4+0+4)/(3-1) = 8/2 =4. That is, if there are N numbers (3 in the example), N-1 is used. The reason for this is explained here: Bessel’s correction.
To compute the tracking error, we replace the numbers by return differences.
For example over three months, the fund/ETF has a (monthly) return of 0.9%, 0.8%, 0.1%. The corresponding index returns are 1.1%, 1.2%, and 0.5%.
The differences are (0.9%-1.1%), (0.8% – 1.2%) and (0.1%-0.5%).
We compute the square of these differences:
(0.9%-1.1%)^2, (0.8% – 1.2%)^2 and (0.1%-0.5%)^2
The sum of these squares is 0.0036%
Tracking error = Square root of [0.0036%/(3-1)] = 0.42% Here 3-1 refers to total number of number (3) minus 1.
There is just the NAV for an index fund, so there is no problem when we talk about return deviations or tracking errors. For an ETF, though, we have a price which is used for day-to-day buying and selling, and there is a NAV. The ETF price determines the return for retail investors, not the ETF NAV.
Inspite of this, all ETF returns, and tracking errors are computed only with the NAV and not the price. It is well known that for many ETFs, the price can differ from the NAV significantly, and this difference can last for weeks or months.
Let us see how this can be misleading.
Let us take LIC MF Nifty 50 ETF as an example.
The tracking errors using ETF NAV over the 1,2,3,4 and 5 years, respectively, are:
0.0139%, 0.0268%, 0.0366%, 0.0328%, 0.0307%
That does not seem so bad, is it? After all, SBI NIfty 50 ETF had a much higher NAV tracking error over 2Y: 0.3848%
Things look quite different when we calculate the tracking error using ETF price.
The tracking errors using LIC MF Nifty 50 ETF price for over the 1,2,3,4 and 5 years, respectively, are:
5.2000% 4.9588% 4.1237% 3.5984% 3.2577%
Notice the huge difference! This is because the price has fluctuated significantly. This is a screenshot from Value Research of the price vs NAV deviation in 2021.
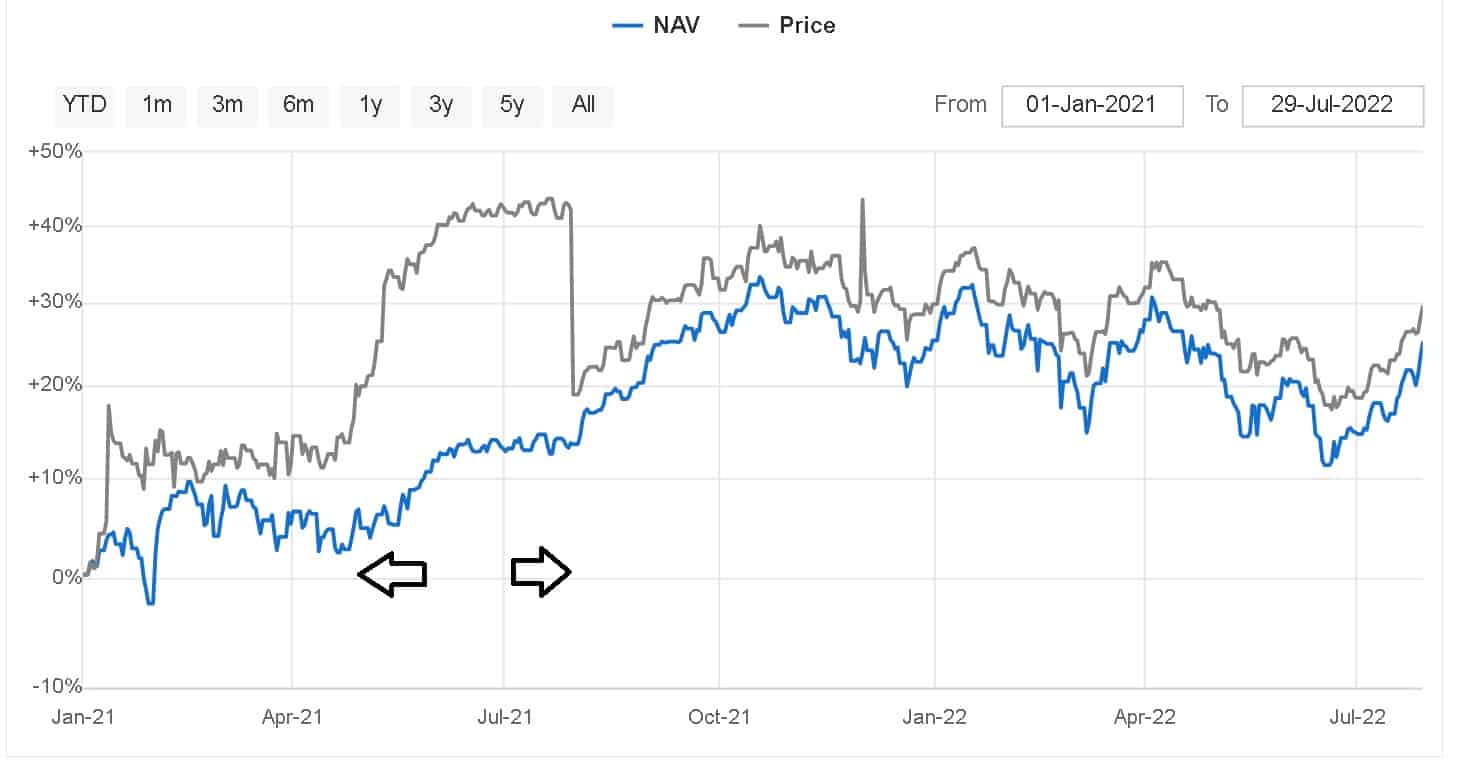
SBI Nifty ETF tracking error based on price is only 0.4094% over the last 2Y, which is only a bit higher than the NAV tracking error based on NAV: 0.3848%.
SBI has done a much better job handling price-nav deviation than LIC in spite of handling EPFO investments and redemptions.
The NAV-based tracking errors can be quite misleading. One will have to look at the volumes traded or “see” the price-nav chart to appreciate the efficacy of an ETF. Instead of these crude estimates, a price-based tracking error and tracking deviation can instantly tell us whether an ETF is worthy of investment or not.
Even for Nifty Bees, one of the well-managed ETFs, the price-based tracking error is 2870 times higher than the nav-based tracking error over the last year!
The solution: Regular readers may be aware that we publish tracking errors and tracking deviation for index funds over the last 1,2,3… 7.8.9 years on a monthly basis.
This is our new ETF tracking error and tracking deviation screener based on NAV and price to address this problem.
In summary, we have shown that ETF-based tracking error data does not capture the actual price-nav deviations seen in an ETF. Since the price determines investor gain or loss, tracking errors and tracking deviations should also be based on ETF price.