Last Updated on April 8, 2024 at 9:38 pm
In this article, we discuss a simple tactical entry and exit strategy for small cap mutual funds based on how expensive they are compared to the Nifty 50. The aim is to reduce the risk of investing in a small cap mutual fund.
Before we proceed, several warnings, disclaimers and caveats should be disclosed. Unless you appreciate these, please do not proceed further.
- The entry and exit signal chosen (explained below) is arbitrary and based on past data, which is not too long (only since April 2005). The same criterion may or may not work in future. Similar to metrics like PE and PB, this will change as market history is added.
- A backtest may look wonderful today, but that does not guarantee it will work in future. See, for example, A risk in market timing that 122 years of backtesting failed to reveal! There is no guarantee that it will work in future.
- This is especially true of most Indian indices, particularly small cap indices, where the historical data is quite short, and the actual traded history is often even shorter.
- Anyone who uses the ideas described here or in our tactical asset allocation archive of articles does so at their own risk. Freefincal or this author/editor is not responsible or liable for any gains or losses that may result.
- Results shown in backtests do not factor in future market movements, human emotions, taxation and exit loads. All these would impact the outcome of market timing.
Nifty Small Cap 250 TRI data is available from 1st April 2005, starting at Rs. 1000 per unit. Normalize the value of Nifty 50 TRI at this date to also be Rs. 1000 per unit. Then, compute the value of the small index divided by Nifty 50. The higher this ratio is, the more expensive the small cap index is. This is how the ratio evolves with time.
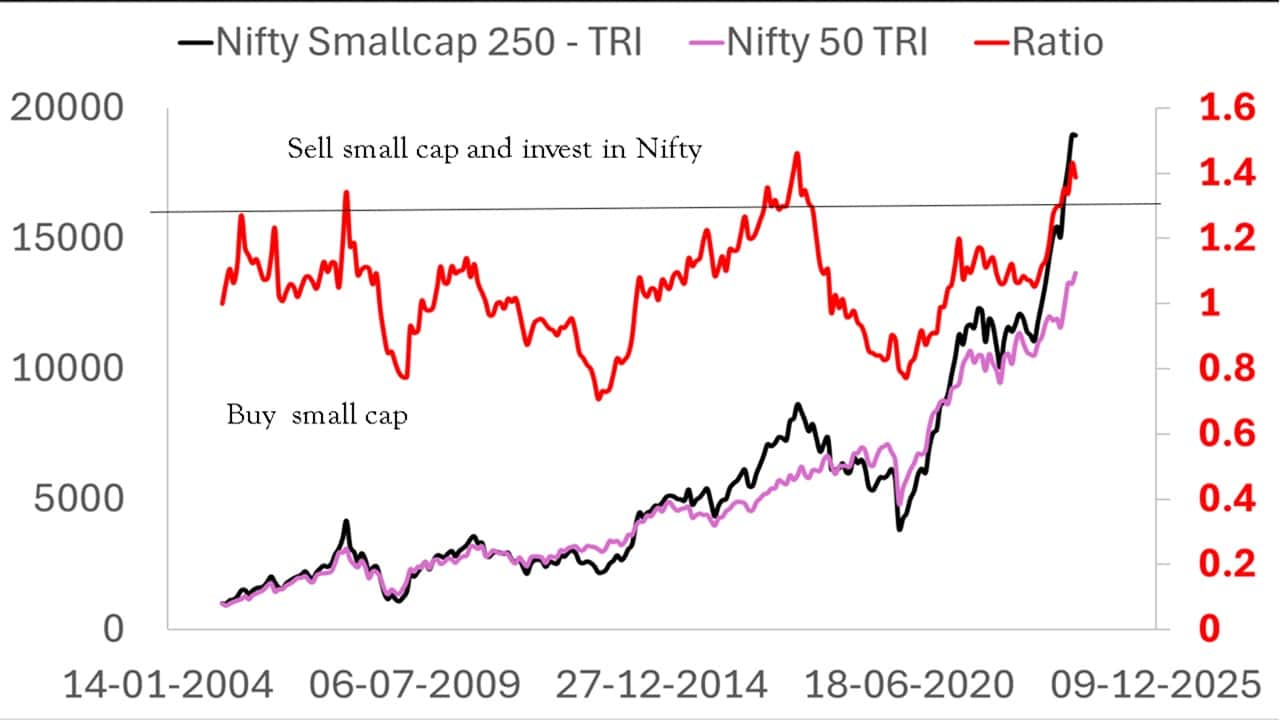
With the full benefit of hindsight, we use the ratio value of 1.3 as the sell trigger.
🔥Secure your future with our Robo-advisory tool trusted by over 3,500 investors and advisors. From effortless retirement planning to funding your children’s biggest dreams, turn your financial goals into reality. 🔥
Subscribe for money management solutions via email! (Link takes you to our email sign-up form) Join 32,000+ readers in our community.
👉 New Tool Alert! NaviPlan: A Privacy-Focused Multi-asset Tracker and Goal Planner 👈
- If the ratio >= 1.3 (when you check once a month), sell the small cap mutual fund (here it is the index) and invest in Nifty 50. If it continues at this level, keep buying Nifty 50 each month.
- If the ratio < 1.3, buy the small cap mutual fund each month.
Unlike our previous tactical studies, it is profit booking from small cap funds to the Nifty 50. We do not sell the Nifty 50 when the small cap index is down.
This is one run for 18 years.
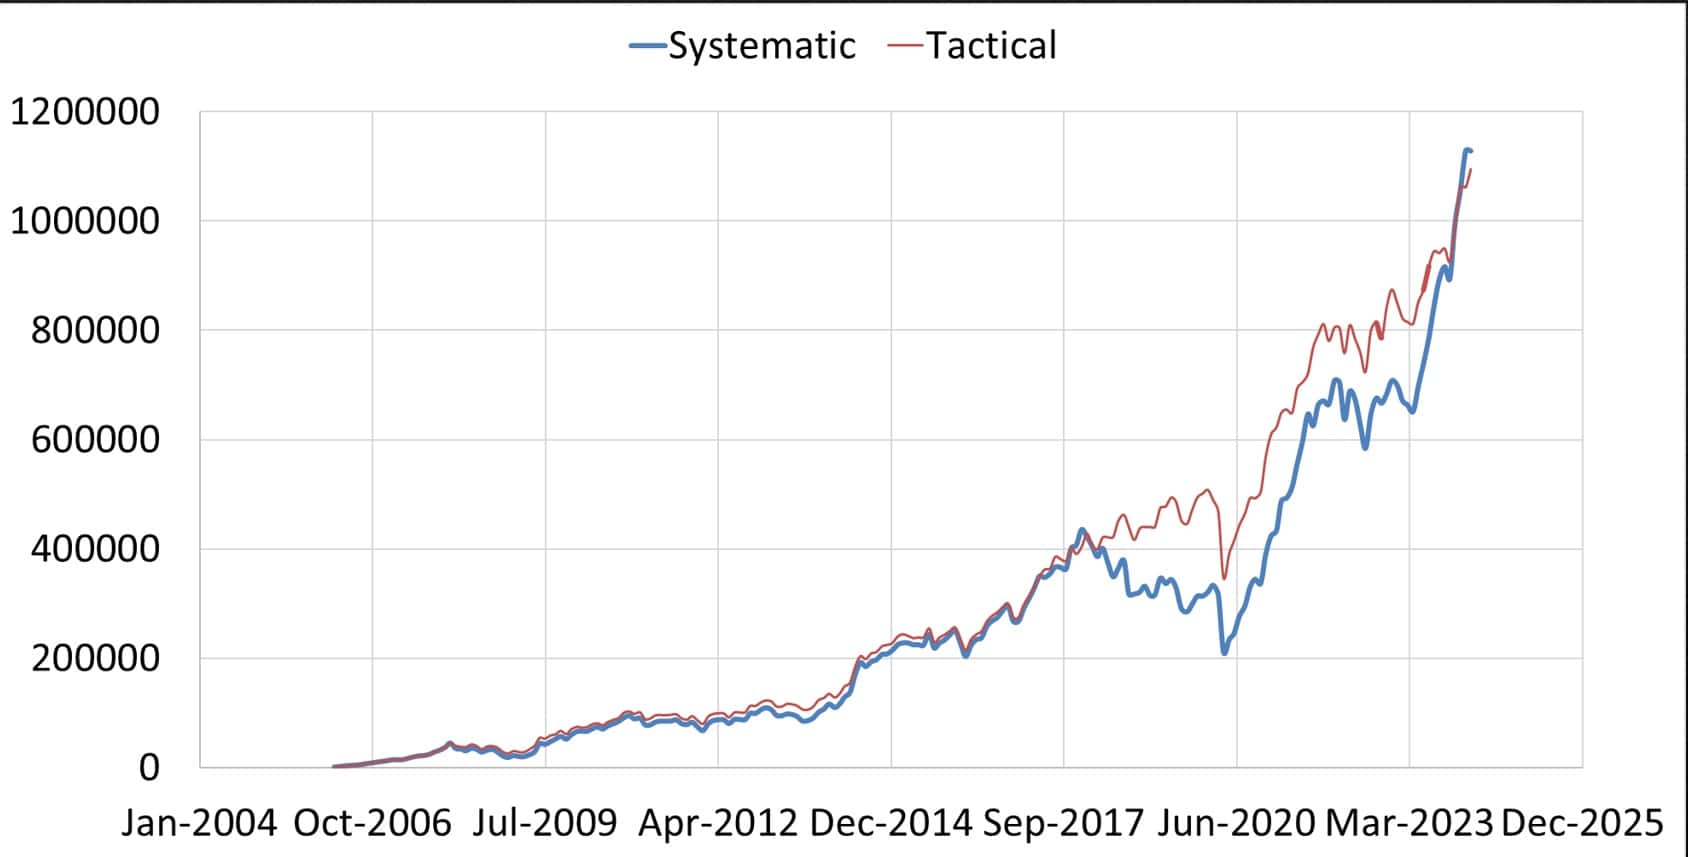
Notice that the primary aim of the tactical strategy is to reduce the risk in the journey. Sometimes, it may result in higher returns (which we know only at the end of the journey) and not (as in the above example).
We can get further insights if we run the analysis for ten years. However, please note that the data (108 10Y runs) is still limited. So, this should not be considered as a probability of success.
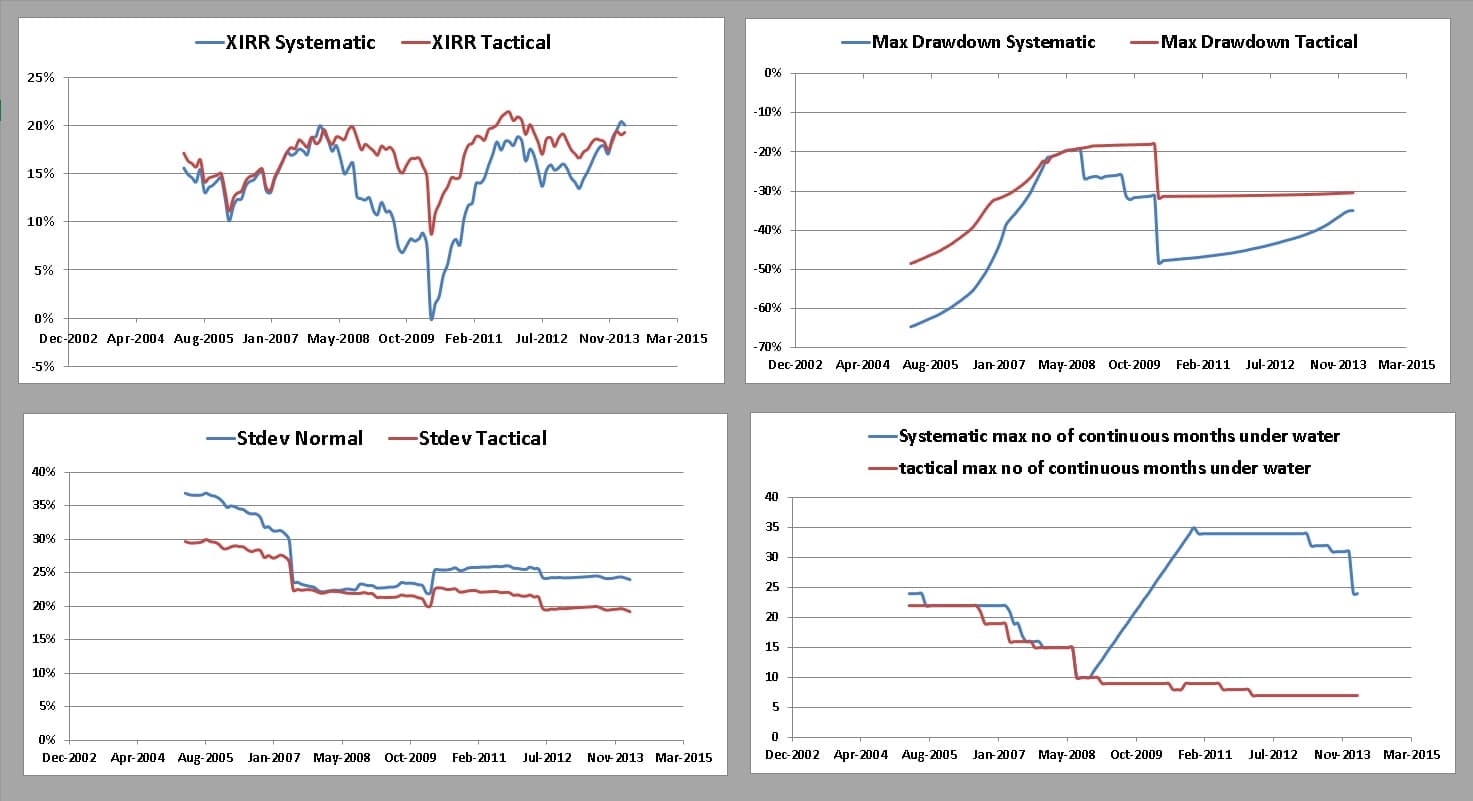
- Top left panel: the XIRR. The tactical strategy has done quite well for the period studied, but not always. It works well, especially when the small cap index goes through prolonged bear runs (which is inevitable).
- Top right panel: The portfolio’s maximum drawdown (max fall from peak) is shown (the less negative, the better). The tactical strategy often has a lower drawdown. That is a lower risk.
- Bottom left panel: The standard deviation or volatility (lower the better). The tactical approach has lower volatility.
- Bottom right panel: the maximum number of months the portfolio was below its peak or underwater (lower the better). Often, the tactical strategy takes less time to recover.
Suppose we compute the risk-adjusted return via the Sharpe Ratio = (Strategy return minus risk-free return) divided by the standard deviation of the strategy. The risk-free rate was set at 6%. We see that the tactical strategy has typically done better.
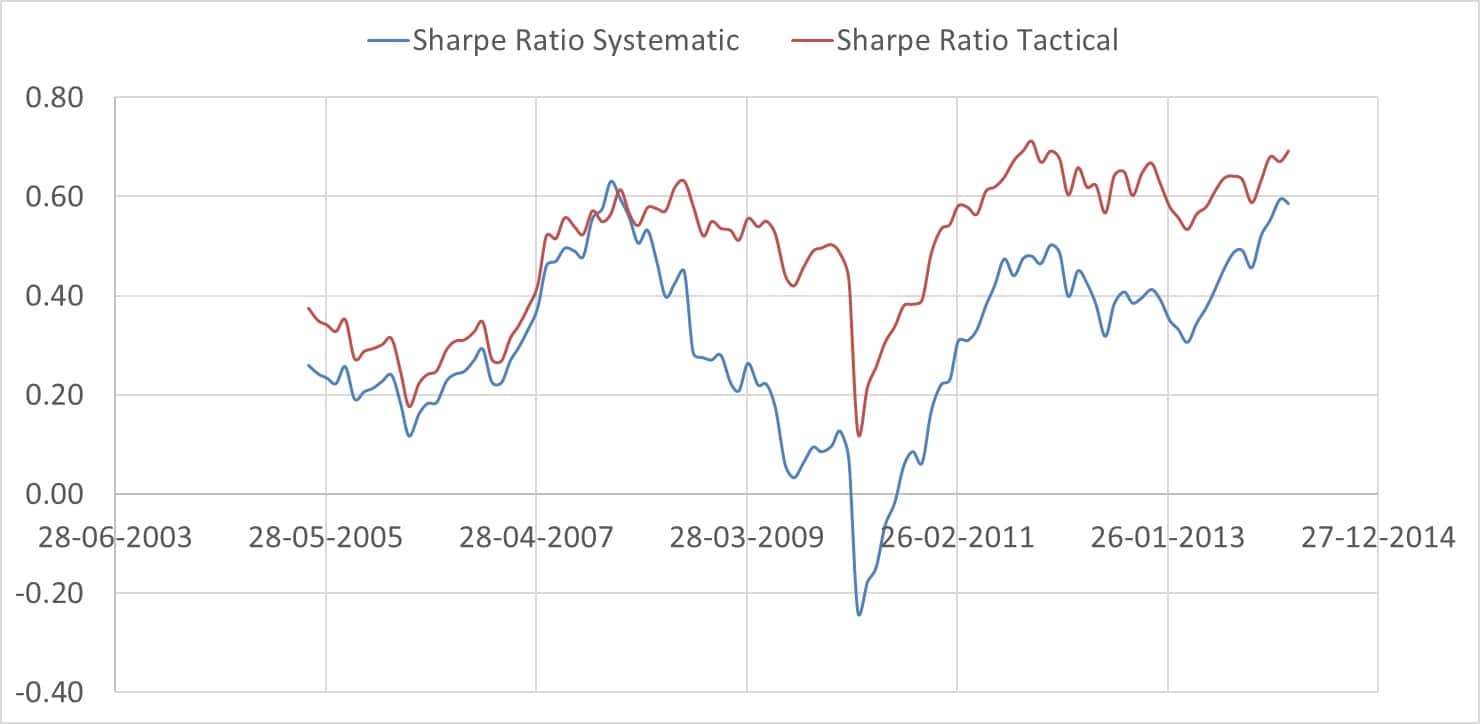
In summary, based on the ratio of Nifty Small Cap 250 TRI to Nifty 50 TRI, this tactical strategy reduces the risk while investing in a small cap mutual fund. While its reward may not always be higher (we will know this only at the end of the journey), its risk-adjusted return (reward per unit risk taken) is typically better. Warnings, caveats and disclaimers, as mentioned above, still apply.
There is an alternate strategy based on double-moving averages, which comes with higher risk and potentially higher reward when compared to a systematic investment. We had presented some sample runs earlier – Do not use SIPs for Small Cap Mutual Funds: Try this instead! We shall present an updated study as a sequel to the present study soon.
Next see: A tactical entry and exit strategy for small cap Mutual Funds – Part 2