We compare the rolling returns of Nifty 50, Nifty Next 50, Nifty Midcap 150 and Nifty Smallcap 250. We publish this comparison from time to time. This is the April 2024 edition.
Returns for a financial instrument that fluctuates can be calculated in two ways:
Point-to-point returns: The effective annual compounded growth rate (CAGR) is calculated between two dates. You can calculate CAGR for your mutual fund and compare it with its benchmark from Jan. 1st to Dec. 31st, or you can calculate CAGR for the year to date (last 365 days). So, the start and end dates can be convenient for us.
What we need to know before choosing a mutual fund, or more importantly before deciding to quit a mutual fund scheme, is how consistent the fund’s performance is when compared with its benchmark. To do this, we need to use Rolling returns.
Calculating Rolling returns: To calculate rolling returns, we must again decide on start and end dates. Let us say this is a 10-month period. We then calculate the percentage change in the fund’s NAV from day 1 (start date) to day 7 (weekly return or IRR). We then calculate the weekly return from day 2 to day 8, day 3 to day 9, and so on until we reach the last date. We repeat this exercise for the benchmark as well.
🔥Secure your future with our Robo-advisory tool trusted by over 3,500 investors and advisors. From effortless retirement planning to funding your children’s biggest dreams, turn your financial goals into reality. 🔥
Subscribe for money management solutions via email! (Link takes you to our email sign-up form) Join 32,000+ readers in our community.
👉 New Tool Alert! NaviPlan: A Privacy-Focused Multi-asset Tracker and Goal Planner 👈
If all the dates in our NAV and index history are identical, we could determine how many weeks the fund has outperformed its benchmark. If the fund has beaten its benchmark 75% of all available rolling returns, it could be rated high! This is the basis of our monthly equity mutual fund performance consistency screeners. Those who wish to generate graphs like the ones shown below can use the mutual fund analysis tool that is part of the freefincal investor circle.
Ten-year rolling returns
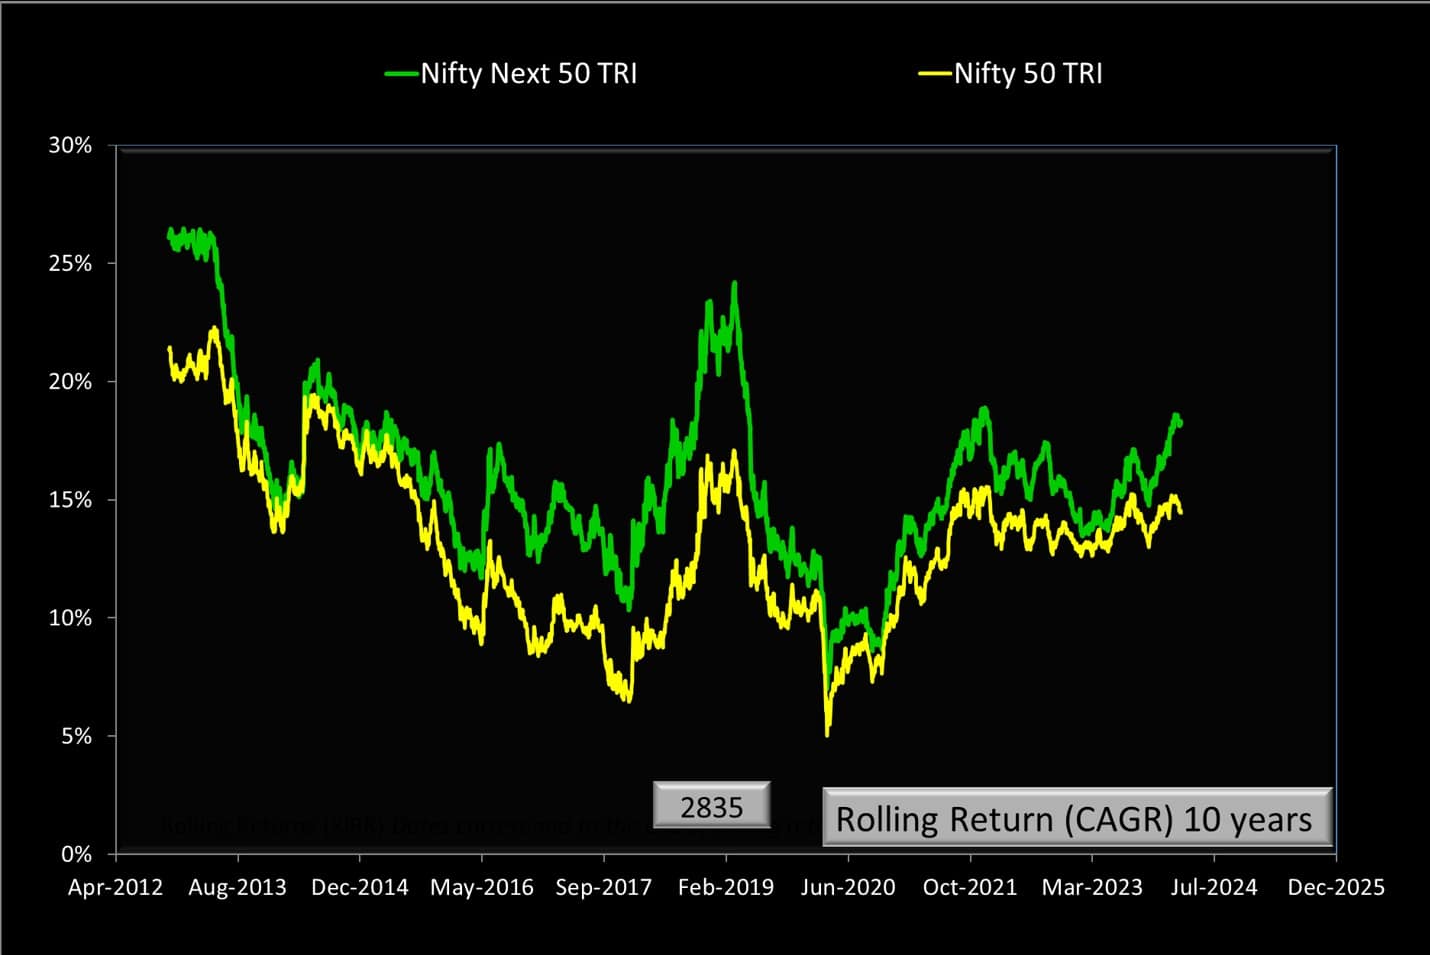
Over ten years, the Nifty Next 50 has just about managed to keep its head above Nifty 50. From time to time, the outperformance vanishes and then increases.
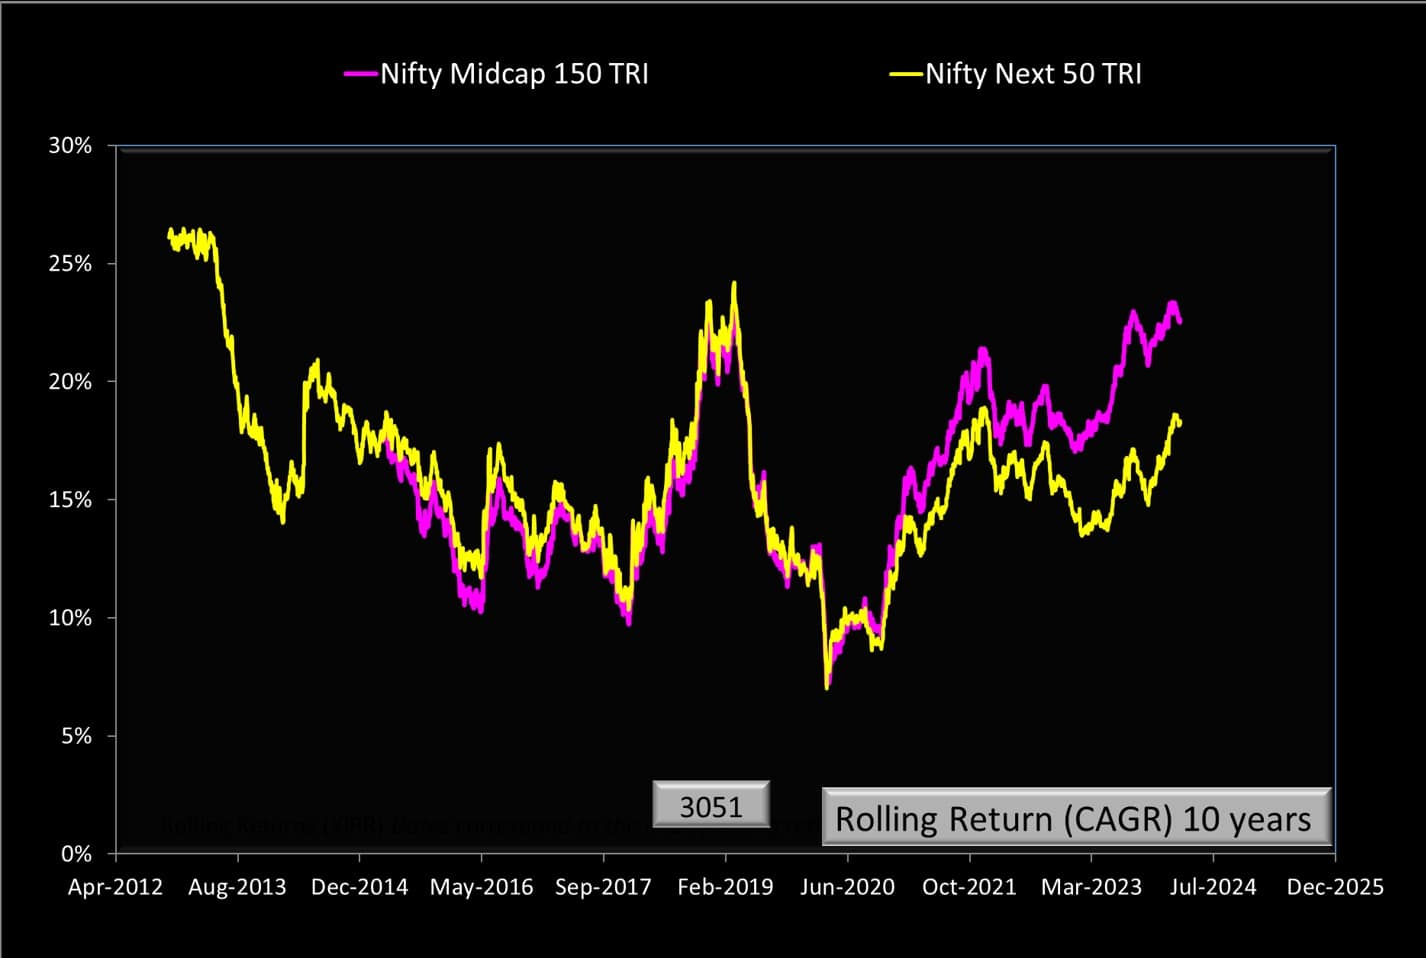
The recent surge in mid cap indices is more apparent in the above graph. This suggests that Nifty Next 50 has become less volatile than the mid cap index. Let us see how things pan out in future. Do not expect the midcap outperformance to last!
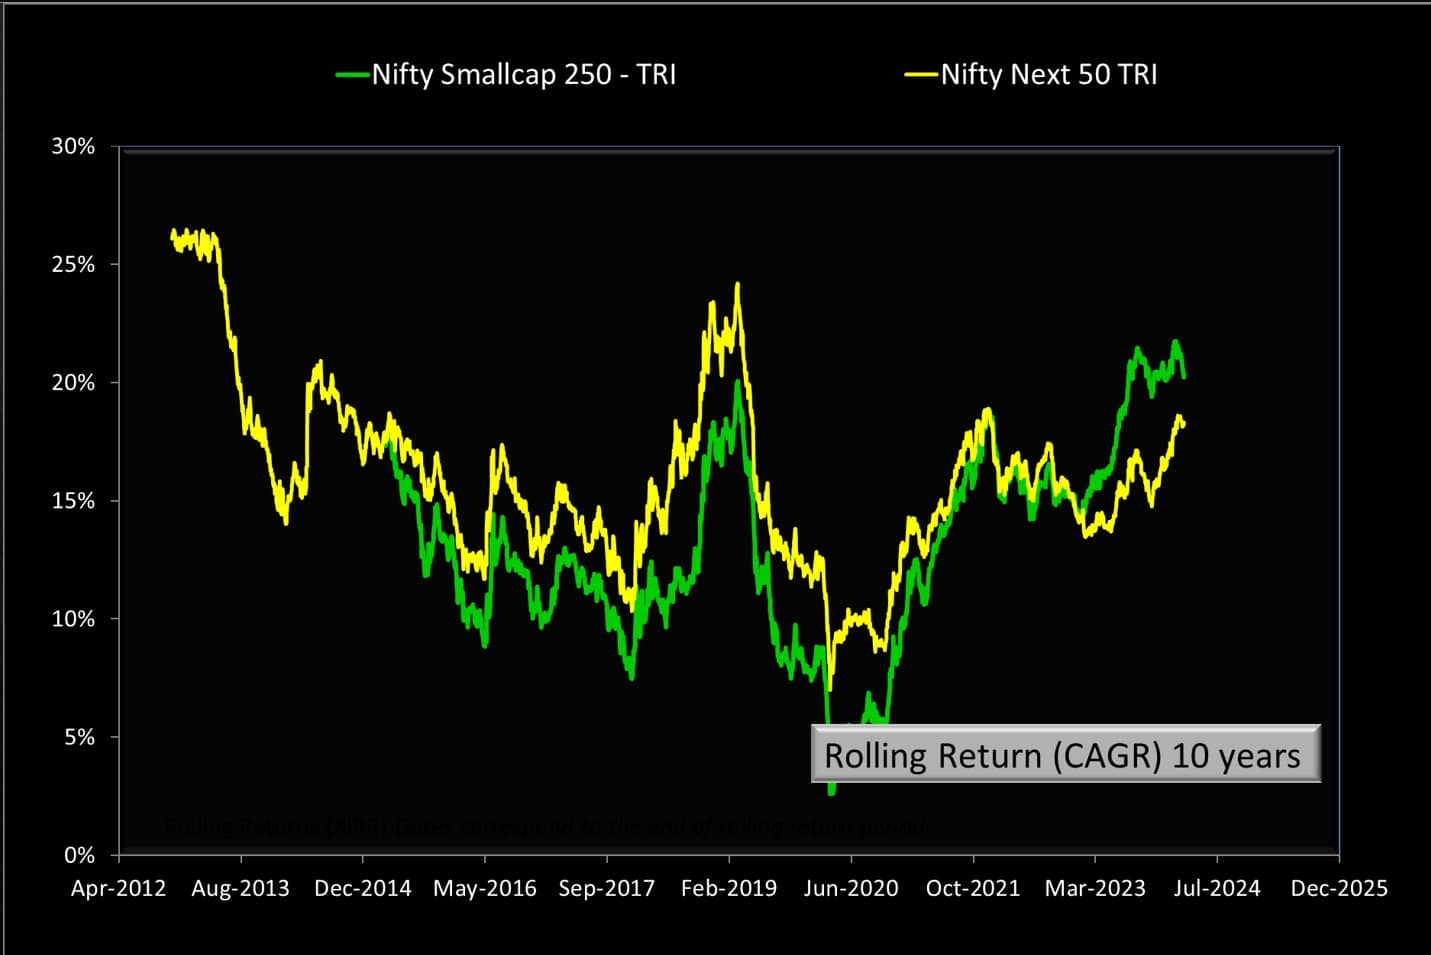
The surge in small cap returns is again apparent in the above graph. And again, it will not last!
The small and mid cap indices are compared below with the Nifty 50.
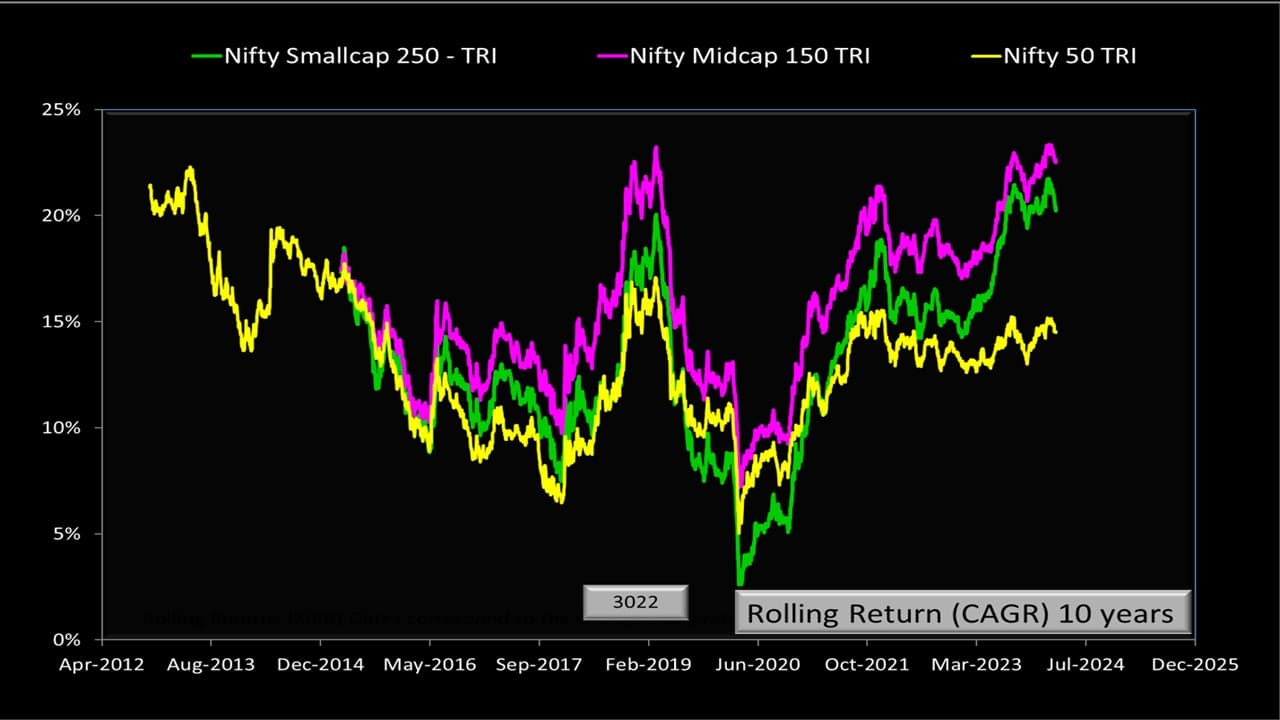
We recently showed that most actively managed small cap indices cannot beat Nifty Midcap 150. See Active Mutual Funds Outperformance Consistency Report (March 2024). Readers can now perhaps appreciate why we insist on benchmarking active small cap funds with midcap 150 and not small cap 250: Why are you comparing Small Cap Mutual Funds with a Mid Cap Index?!
So, if I am looking for a companion to the Nifty 50 in my portfolio (not necessary IMO), I can safely eliminate all active funds (large, mid, small, focused, flexicap, etc) – see the above report for details. I can also eliminate small cap index funds.
So, should I choose Nifty Midcap 150 index funds or Nifty Next 50 index funds? As we saw above, the Micap index has only recently outperformed the Nifty Next 50 (which has recently recovered a bit).
Will this trend continue? No one can say. However, we can expect the margin of outperformance to come down in the future.
Has Nifty Next 50 become increasingly large-capish due to higher market participation? (See our earlier report: Warning! Nifty Next 50 is NOT a large cap index!). Does this mean the reward for holding Nifty Next 50 (considering the risk taken) would be lower in the future? Again, no one can say.
Perhaps it is reasonable to assume that the Nifty Next 50 will be less risky and rewarding than the Nifty Midcap 150 in future. Perhaps its risk premium compared to Nifty 50 may also be lower.
Does this mean the midcap index is a better choice? Not quite. During a crisis, the mid cap index would be quite volatile with huge drawdowns (fall from a maximum), and how efficiently fund managers could track the index is unknown as liquidity can be a concern due to large impact costs.
Therefore, we recommend the following:
- Investors stick to a simple Nify 50 or Sensex index fund. Nothing more is needed.
- If there is a sense of FOMO, then a small exposure of Nifty Next 50 is sufficient. This can be frustrating to hold from time to time, but that is also true of the mid cap index.
- See Handpicked List of Mutual Funds (PlumbLine) for our fund recommendations.