Last Updated on December 3, 2020 at 3:48 pm
The 10th version of the freefincal automated stock analyzer includes an easy-to-understand graphical analysis of the factors that drive return on equity (ROE) using the five-step Dupont Analysis.
Return on equity is defined as
ROE = Net income/shareholders equity.
It is the profit for each unit of shareholders equity or the earning power of the company. If there is a gradual increase or decrease in ROE, it is beneficial to dig deeper and find out the reasons behind the trend.
🔥Secure your future with our Robo-advisory tool trusted by over 3,500 investors and advisors. From effortless retirement planning to funding your children’s biggest dreams, turn your financial goals into reality. 🔥
Subscribe for money management solutions via email! (Link takes you to our email sign-up form) Join 32,000+ readers in our community.
👉 New Tool Alert! NaviPlan: A Privacy-Focused Multi-asset Tracker and Goal Planner 👈
Deconstructing the ROE into multiple factors helps us understand the factors that drive the ROE change. This was first done by DuPont explosives salesman Donaldson Brown in 1912 and hence the name Dupont formula.
In its modern form, the ROE is written as a product of five ratios.
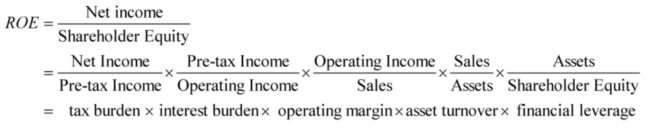
Thus the ROE is the product of
- Financial leverage
- asset turnover
- operating margin
- interest burden
- tax burden.
1. The financial leverage is a measure of a companies debt. Higher the leverage, higher the borrowing and it could result in an increase in ROE! Therefore, if a fall in ROE is driven by a fall in financial leverage it is probably a good development.
2. Asset turnover is a measure of how well assets (including debt) are used to generate profit. An increase in ROE coupled with an increase in asset turnover is desirable. Decreasing asset turnover but steady/increasing revenue could imply the presence of unproductive assets.
3. Operating margin can be thought of as the profit left over after paying for production costs. A healthy operating margin is necessary to pay back debt. An increase in financial leverage should soon result in an increase in operating margin!
4. Interest burden represents the extent interest that has to be paid out to lenders. When financial leverage increases, interest burden will also increase.
5. Tax burden is a measure of the taxes that has to be paid. When interest burden increases, tax burden will usually decrease.
As with all financial ratios and balance sheet entries, these are heavily industry dependent.
Here is an example screenshot (click to enlarge) of the Dupont analysis page. The financial data is automatically downloaded from Morning Star.
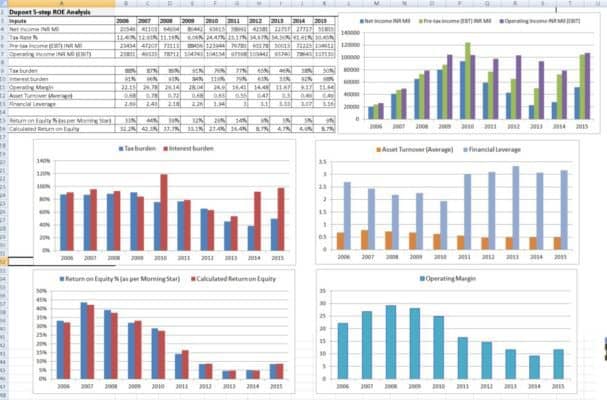
The ROE has dropped significantly. The main ROE driver appears to be a fall in operating margin and net income. However, financial leverage has increased and therefore so has the interest burden.
The operating margin seems to have picked up last FY which is important considering the higher interest burden. While I do not know the reasons behind the fall, there are indications of a recent increase in profitability. Excuse me if this is not a very effective example for demonstrating ROE drivers, I am only a student. In any case, I had a wonderful time trying to understand about ROE drivers behind Colgate, Berger, Emami and other companies.
Other Features
The automated stock analysis sheet
- pulls financials from morningstar and analyzes them
- pulls adjusted stock price history from money control, and
- calculates intrinsic value six different ways!
It also pulls annual (standalone/consolidated) and quarterly financials from Value Research online.
Valuation models available:
1) Price Multiple Model
2) Sustainable Growth Rate
3) Book Value Growth Rate (Buffett’s approach to valuation)
4) Discounted Cash FlowOpens in a new windowOpens in a new window (DCF)
6) Graham formula and Graham number
7) Piotroski Score for the last 9 financial yearsOpens in a new window
8) Earnings Growth Estimate.
Download version 14th of the freefincal stock analyzer June 16th, 2019 <== latest!