You may have seen that mutual fund annualised returns are computed using a method known as XIRR (extended internal rate of return). We explain what this means using a simple example.
When you make a single investment (lump sum for want of a better word) in a mutual fund or stock, the return (after a minimum period of one year) is calculated using the standard compounding formula.
This is also known as the CAGR (compounded annual growth rate). This is simply the basic compounding formula: Value = Investment x (1+return)^years. Here ^ refers to “to the power of” like 2^2 = 2*2 = 4.
When you make multiple investments in a mutual fund (or any capital market-linked instrument), you use the XIRR as an equivalent of the CAGR. Both are measures of the annualised return.
Consider the following table. Investments of Rs 1000 are made on January 1, 2000, 2001, 2002, 2003, 2004, and 2005. A negative sign is necessary to use in the formula for the XIRR.
🔥Secure your future with our Robo-advisory tool trusted by over 3,500 investors and advisors. From effortless retirement planning to funding your children’s biggest dreams, turn your financial goals into reality. 🔥
Subscribe for money management solutions via email! (Link takes you to our email sign-up form) Join 32,000+ readers in our community.
👉 New Tool Alert! NaviPlan: A Privacy-Focused Multi-asset Tracker and Goal Planner 👈
| Date of investment | Amt |
| 01-01-2000 | -1000 |
| 01-01-2001 | -1000 |
| 01-01-2002 | -1000 |
| 01-01-2003 | -1000 |
| 01-01-2004 | -1000 |
| 01-01-2005 | -1000 |
| 01-01-2006 | 10009.71 |
As of 1st January 2006, these investments have a value of Rs. 10009.71.
The XIRR is computed on a spreadsheet using the function =XIRR(Value column, Date column), and for this example, it is 14.82%. This is a pretty vague result. Let us find out how this number comes about.
The investment of Rs. 1000 on 1st January 2000 has a value of Rs. 2335.3 on 1st January 2006. Similarly, we have.
| Date of investment | Value as of Jan 2006 |
| 01-01-2000 | 2335.30 |
| 01-01-2001 | 2064.99 |
| 01-01-2002 | 1774.81 |
| 01-01-2003 | 1395.38 |
| 01-01-2004 | 1334.08 |
| 01-01-2005 | 1105.15 |
| 01-01-2006 | |
| Sum | 10009.71 |
We can compute the CAGR of the investment made on 1st January 2000 as on 1st January 2006 using the standard compounding formula.
return = (Value/investment)^(1/years)
This return is 15.17%. Similarly, we have.
| Date of investment | CAGR as on 1st Jan 2006 |
| 01-01-2000 | 15.17% |
| 01-01-2001 | 15.60% |
| 01-01-2002 | 15.41% |
| 01-01-2003 | 11.73% |
| 01-01-2004 | 15.48% |
| 01-01-2005 | 10.52% |
The XIRR is not the average of these CAGR numbers! Then what is it?
To understand the XIRR, we consider the value of Rs. 1000 invested on 1st January 2000 as of 1st January 2006, assuming a return of 14.82% (the XIRR for our example).
The answer is (using the standard compounding formula again ) Rs. 2293.16 (this is different from the actual value of Rs 2335.30). If we repeat this exercise for the other investments, we have the following table.
| Date of investment | Value as of Jan 2006 if return was equal to XIRR of 14.82% | Actual Value as of Jan 2006 |
| 01-01-2000 | 2293.16 | 2335.30 |
| 01-01-2001 | 1996.42 | 2064.99 |
| 01-01-2002 | 1738.74 | 1774.81 |
| 01-01-2003 | 1514.32 | 1395.38 |
| 01-01-2004 | 1318.86 | 1334.08 |
| 01-01-2005 | 1148.20 | 1105.15 |
| Sum | 10009.71 | 10009.71 |
Although the individual “imaginary” present values differ from the actual present values, their sum remains the same! This gives you an idea of what the XIRR is.
The XIRR is that annualised compounding rate which, when applied to each investment, results in the correct total value on the date the return is computed.
This is summarised in the figure below.
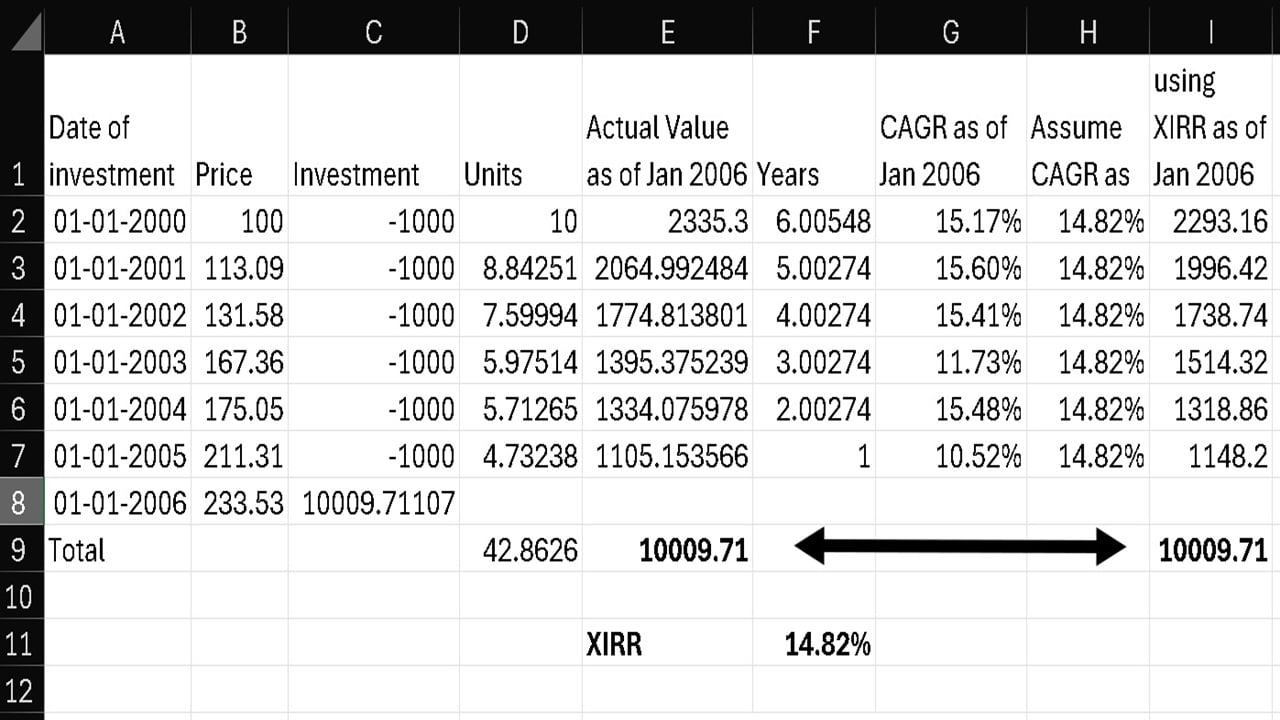
The XIRR can then be computed by setting all individual CAGRs to be the same and by adjusting this value until the sum of the present value matches the actual present value. This can be accomplished by a function known as Goal Seek in Excel. Of course, the standard XIRR function is the easiest to use, but for understanding, the Goal Seek function can be used once. The above processes are explained in this video.
Internally, the XIRR or the Goal Seek Function is an implementation of the Newton-Raphson method (some of you may remember this from school).
In summary, the XIRR is the rate of return that each investment is assumed to grow to arrive at the observed total value on the date of computation. It is not an average CAGR!