In May 2025, the AUM of Parag Parikh Flexi Cap Fund crossed 1,00,000 Crores, making it the most popular active fund. Will this large AUM affect its performance?
AUM vs. performance is a tricky subject, and it isn’t easy to draw useful conclusions. What we can say for sure is that AUM is likely to impact flexibility. This is our earlier research on the subject:
- Mutual Fund Size vs. Performance: A Case Study
- Does the size of a mutual fund affect its performance?
For example, a small cap fund that gains popularity will be forced to add more large cap stocks to ensure enough liquidity to handle large AUM inflows or outflows. A fund churning its portfolio a lot when its AUM was low will be forced to churn less as the inflows swell.
Generally, a large AUM makes it difficult for the fund manager to sell a stock hit by bad news or lose the market’s favour. It also makes it difficult to buy large quantities of a good stock. The problem is. All these seem obvious, but it is hard to correlate this with poor performance.
Take the case of a Parag Parikh Flexi Cap Fund. What do you expect to happen to its portfolio as its AUM increases?
🔥Secure your future with our Robo-advisory tool trusted by over 3,500 investors and advisors. From effortless retirement planning to funding your children’s biggest dreams, turn your financial goals into reality. 🔥
Subscribe for money management solutions via email! (Link takes you to our email sign-up form) Join 32,000+ readers in our community.
👉 New Tool Alert! NaviPlan: A Privacy-Focused Multi-asset Tracker and Goal Planner 👈
- It should hold lower and lower quantities of (Indian) mid cap and small cap stocks.
- Its portfolio turnover ratio could go down.
Let us find out if this is true. Before we do this, there is yet another aspect of the fund’s performance that must be taken into account. In the past, it held 25-30% of international stocks, which played a role in boosting performance. Due to RBI restrictions on investing in international stocks, this exposure has dropped to about 10%. This aspect is definitely a “past performance will not be repeated in the future” consideration.
Now let’s get to it.
Parag Parikh Flexi Cap Fund’s historical market cap allocation
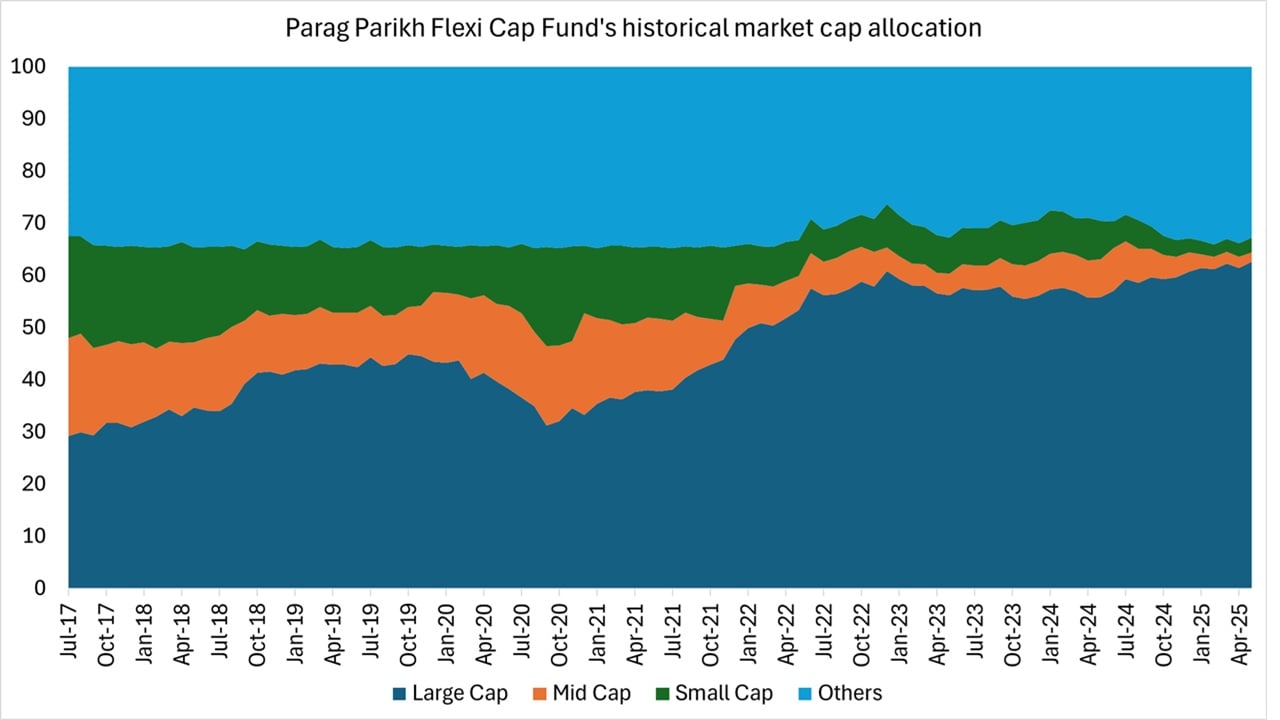
This is only with repect to Indian equity holdings. The “others” represent both cash and international equity holdings. The siginificant reduction of mid cap and small cap holdings is probably the most important indicator we have of the impact of the fund’s growing AUM.
However, this is not a perfect indicator. The cash/bond holdings (see below) can be used to buy mid and small caps in future. Only time will tell how much a “flexicap” the fund will be.
The most important indicator that AUM has not affected the fund managers ability to churn is shown below.
Parag Parikh Flexi Cap Fund’s historical AUM growth and portfolio turnover ratio
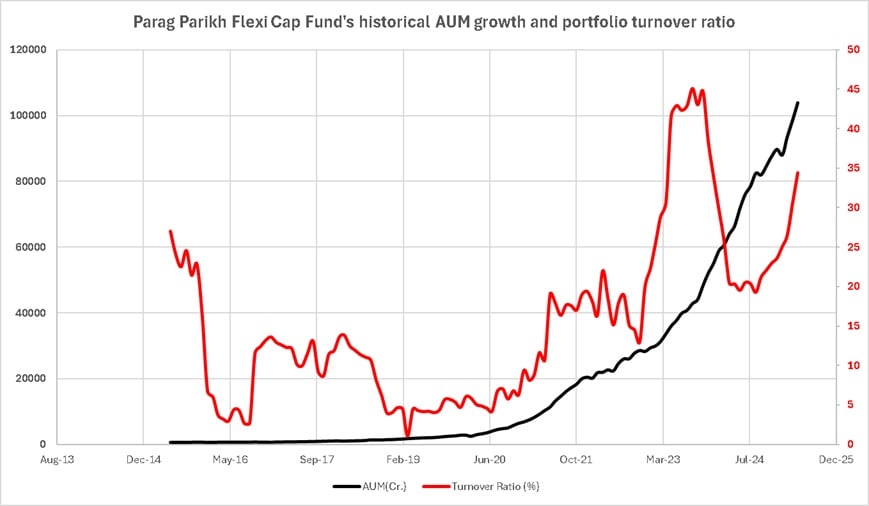
There is no correlation between the two. This is an incomplete contrast to our previous study: Kotak Flexicap Mutual Fund Review: Is AUM affecting its performance?
The one favourable aspect of the fund management style is its low portfolio churn ratio. Many funds churn quite a bit when the AUM is low, and grow more and more sedate as the size grows. That has not been the case for Parag Parikh Flexi Cap Fund.
Monthly % Change in AUM minus % change in NAV
AUM increase is due to (1) Capital gain and (2) Inflow. To get an approximate sense of the inflow, we plot the difference between the AUM percentage change and NAV percentage change.
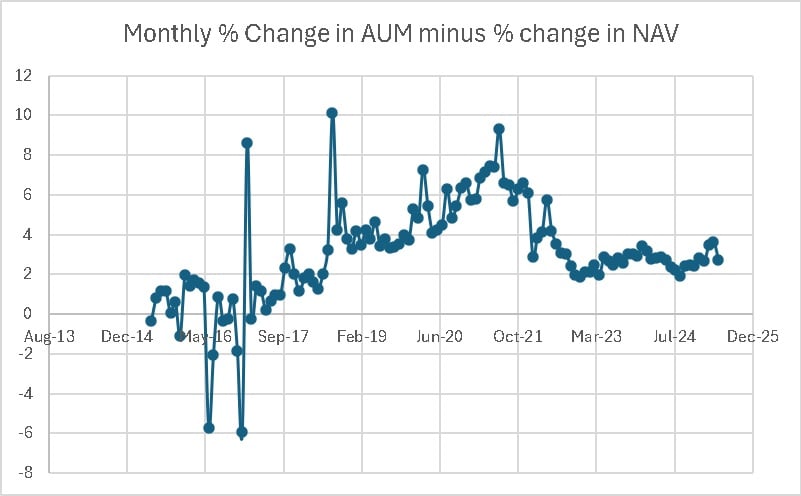
This suggests, leaving aside the pre-pandemic surge in popularity, that the inflows in the last couple of years have been steady. This is good for both the fund’s existing investors and the fund management. Sudden increases in inflow can be quite problematic. A steady influx is much more manageable. That seems to be the case recently.
Parag Parikh Flexi Cap Fund’s historical Domestic Equities, Cash & Cash Equivalents and Overseas Equity holdings, along with its portfolio turnover ratio
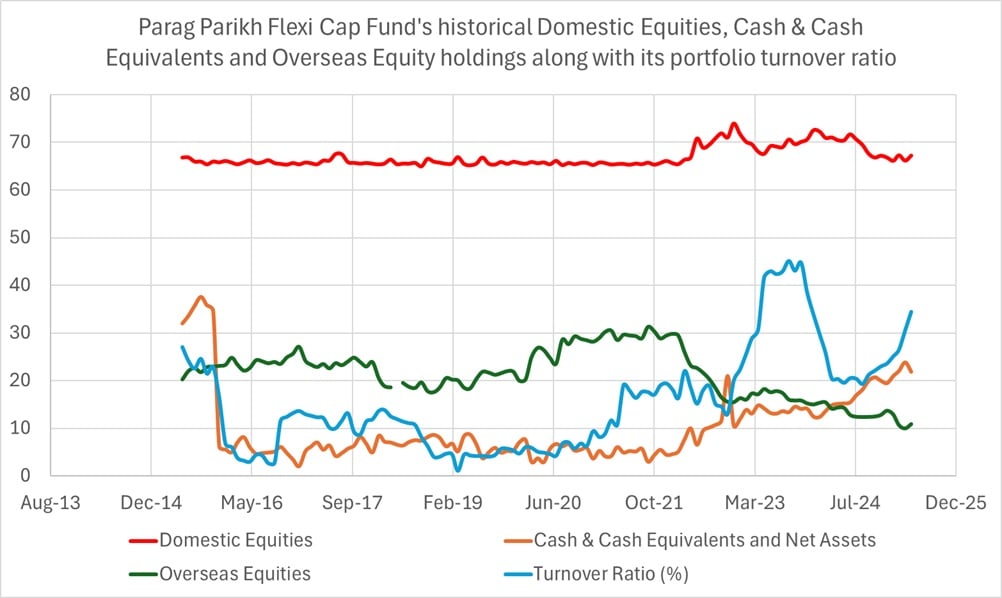
The overseas equity drop and the gradual increase in cash/bond holdings are the most important recent changes, although they do not seem to correlate 1-to-1 with the portfolio turnover ratio.
Performance analysis of Parag Parikh Flexi Cap Fund
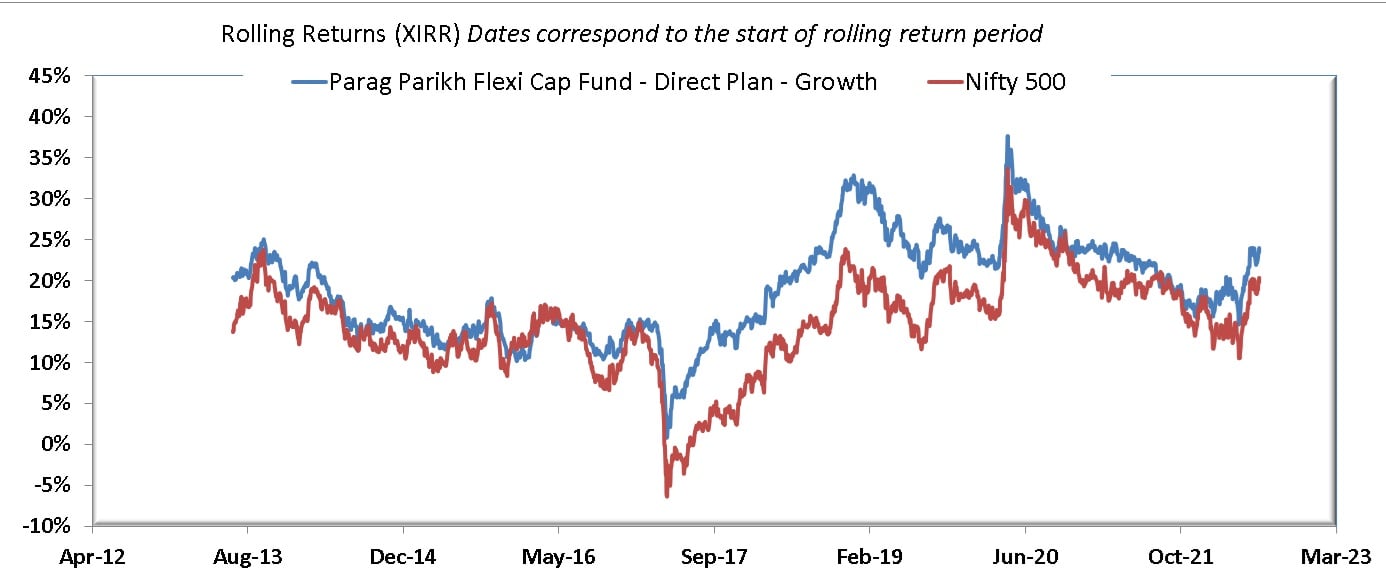
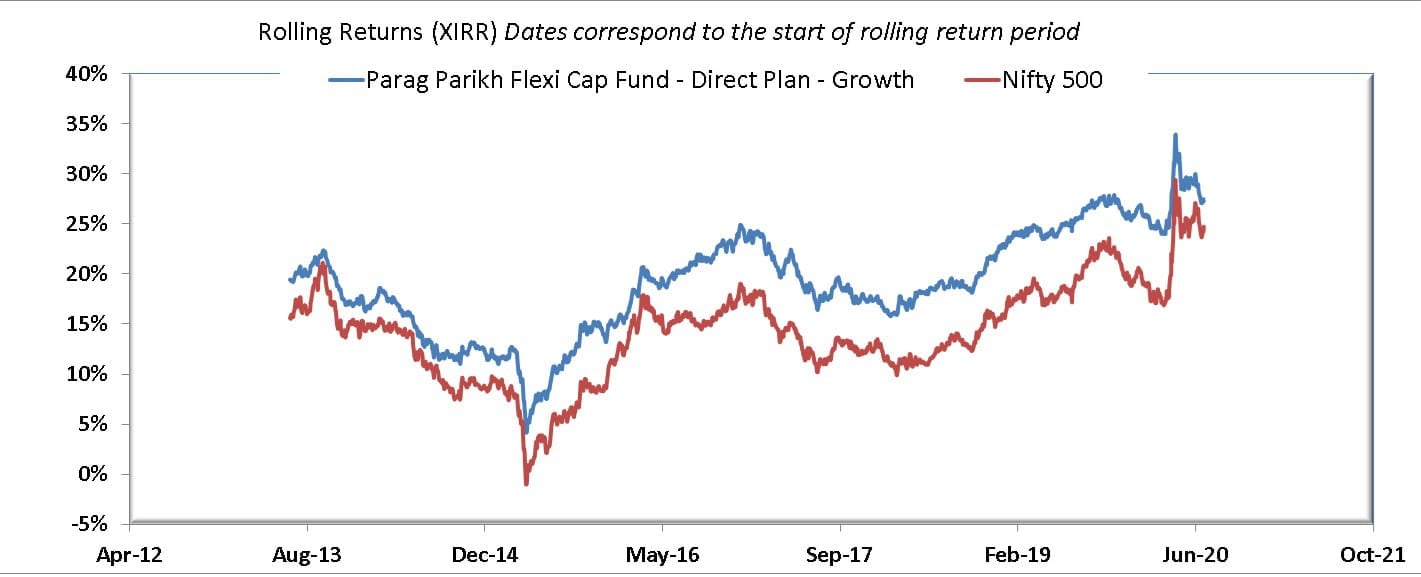
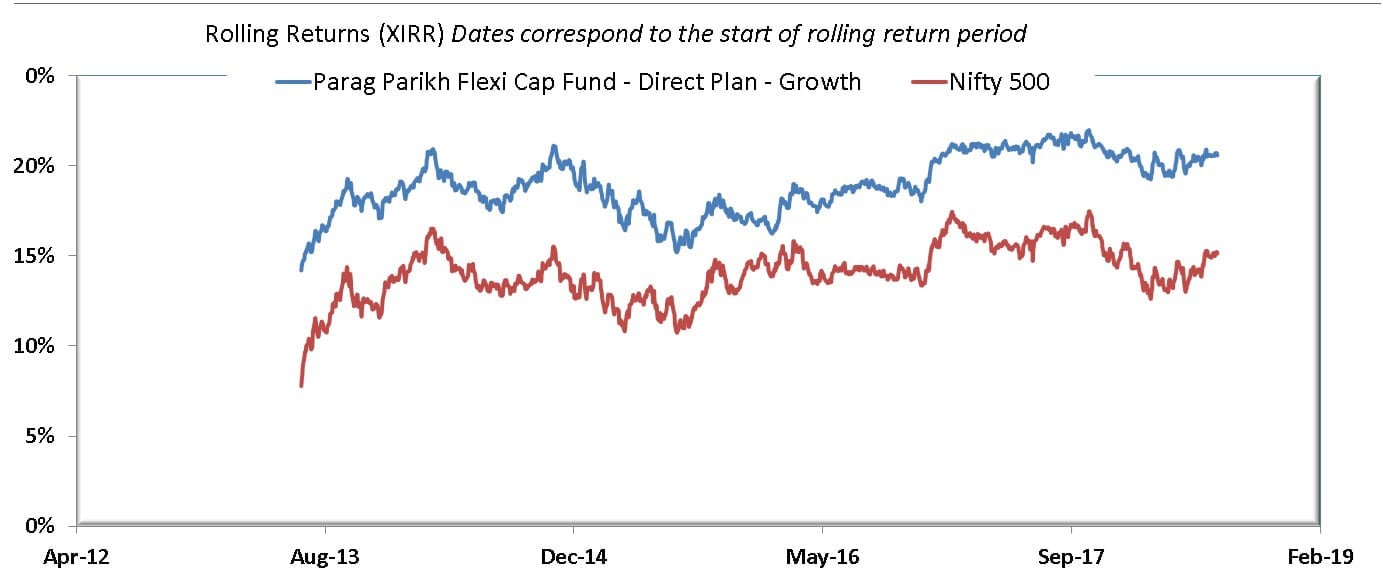
In line with our previous studies, rolling return graphs do not correlate with AUM hikes. Please keep in mind that the find is still quite young. As you increase the rolling return duration, the number of data points and the time window in the horizontal axis will come down. These graphs were created with the MF Analyser tool, which is part of the freefincal investor circle.
3Y rolling returns: The fund has managed to keep its nose above the benchmark, but there is no correlation with the AUM
5Y rolling returns: Again, not much correlation with AUM. The recent drop in outperformance could be due to the cash holding and lower exposure to mid and small cap stocks.
7Y rolling returns: Doesn’t mean much, very little data.
We source the following data from our monthly active mutual fund performance screener.
1 Rolling return outperformance consistency: the fund returns are compared with category benchmark returns over every possible 3Y,4Y, 5Y period. The higher the outperformance consistency, the better. Suppose 876 fund returns were compared with 876 benchmark returns, and the fund has beaten the benchmark 675 times. The consistency score will be 675/876 ~ 77%.
2 Upside performance consistency over every possible 1Y,2Y,3Y,4Y, 5Y: Higher the better. A score of 70% means, 7 out of 10 times, the Fund performed better than the category benchmark when the benchmark increased. This is a measure of reward. It is computed from rolling upside capture data (see link below). Most funds that beat the index consistently do not have consistent upside. See: Strange, but true! How mutual funds beat the index!
3 Downside performance consistency over every possible 1Y, 2Y, 3Y,4Y, and 5Y. The higher, the better. A score of 60% means 6 out of 10 times, the Fund performed better than the category benchmark when the benchmark was moving down. This is a measure of risk protection. It is computed from rolling downside capture data. Read more: An introduction to Downside and Upside Capture Ratios.
Downside protection matters more than upside performance!
| Metric | N200TRI | NIFTY 500 Multicap 50:25:25 TRI | Nifty Largemidcap 250 TRI |
| No of rolling return entries Index (1 Year) | 2696 | 2708 | 2708 |
| No of rolling return entries Fund (1 year) | 2696 | 2708 | 2708 |
| No of times fund has outperformed index (1 year) | 2090 | 1525 | 1523 |
| rolling return outperformance Consistency Score (1 year) | 78% | 56% | 56% |
| upside performance consistency (1 year) | 13% | 10% | 13% |
| downside protection consistency (1 year) | 93% | 98% | 93% |
| No of rolling return entries Index (2 Years) | 2454 | 2466 | 2466 |
| No of rolling return entries Fund (2 years) | 2454 | 2466 | 2466 |
| No of times fund has outperformed index (2 years) | 2141 | 1514 | 1498 |
| rolling return outperformance Consistency Score (2 years) | 87% | 61% | 61% |
| upside performance consistency (2 years) | 7% | 0% | 6% |
| downside protection consistency (2 years) | 100% | 100% | 100% |
| No of rolling return entries Index (3 Years) | 2207 | 2220 | 2219 |
| No of rolling return entries Fund (3 years) | 2207 | 2220 | 2219 |
| No of times fund has outperformed index (3 years) | 2067 | 1421 | 1346 |
| rolling return outperformance Consistency Score (3 years) | 94% | 64% | 61% |
| upside performance consistency (3 years) | 1% | 0% | 0% |
| downside protection consistency (3 years) | 100% | 100% | 100% |
| No of rolling return entries Index (4 Years) | 1959 | 1972 | 1971 |
| No of rolling return entries Fund (4 years) | 1959 | 1972 | 1971 |
| No of times fund has outperformed index (4 years) | 1925 | 1551 | 1533 |
| rolling return outperformance Consistency Score (4 years) | 98% | 79% | 78% |
| upside performance consistency (4 years) | 0% | 0% | 0% |
| downside protection consistency (4 years) | 100% | 100% | 100% |
| No of rolling return entries Index (5 Years) | 1711 | 1723 | 1723 |
| No of rolling return entries Fund (5 years) | 1711 | 1723 | 1723 |
| No of times fund has outperformed index (5 years) | 1711 | 1622 | 1554 |
| rolling return outperformance Consistency Score (5 years) | 100% | 94% | 90% |
| upside performance consistency (5 years) | 0% | 0% | 0% |
| downside protection consistency (5 years) | 100% | 100% | 100% |
That is pretty decent.
At the time of writing, there is no major slip in performance due to the large AUM. There is no correlation between the AUM increase and portfolio churn. The mid and small cap allocations have decreased significantly. We cannot say if this is tactical or because of the AUM.
Therefore, no evidence (as far as my thinking takes me) shows that size has affected the fund’s performance. That said, the fund has had a stellar run since inception (I am an NFO investor. See – Auditing my retirement portfolio for Mint Newspapers Guru Portfolio).
Such an extended winning streak may not last. No one is above the law of averages. Therefore, one should not succumb to the hot hand fallacy and assume past performance will be repeated in the future.
The fund overrelies on its fund manager, Rajeev Thakkar, which is dangerous. While existing investors can continue to hold and invest further in the fund as long as performance is satisfactory, we suggest new investors exercise caution and moderate expectations. We believe they are better off with index funds.