Last Updated on August 30, 2021 at 3:48 pm
Does size matter? Does the size of a mutual influence its performance? Do funds begin to underperform when the assets under management (AUM) increase beyond a certain point?
Be it copulation or investing, questions on size vis-à-vis performance have troubled us forever! This post is not an attempt to answer this question one way or another for I do not think that is possible!
Instead, we consider a case study on HDFC Equity, the fund with largest AUM in India. We trace its AUM history and how it is related to its the portfolio turnover ratio. Then using a rolling returns analysis, we consider the funds performance in ‘low’ and ‘high’ AUM regimes.
This post originates from a discussion with independent financial advisor Swapnil D Kendhe at facebook group Asan Ideas for Wealth. Swapnil writes an interesting blog: An Idealist Professional First let us look at some funds with ‘large’ AUM. 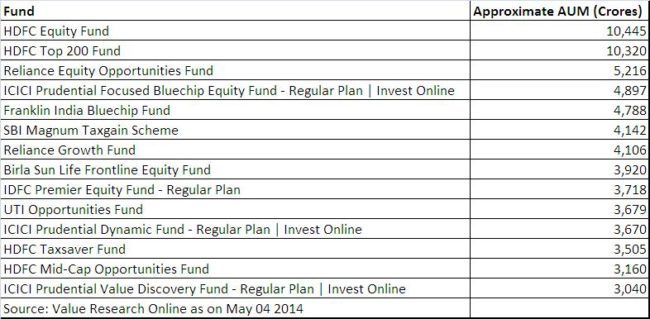 These are the funds with AUM greater than 3000 Crores. Notice that HDFC Equity and Top 200 towers over the rest! Now lets use see how the AUM of both funds have increased with time and see how this has affected the portfolio turnover ratio. The turnover ratio is a measure how frequently the fund manager has bought and sold securities. Data has been sourced from the monthly reports published by HDFC MF.
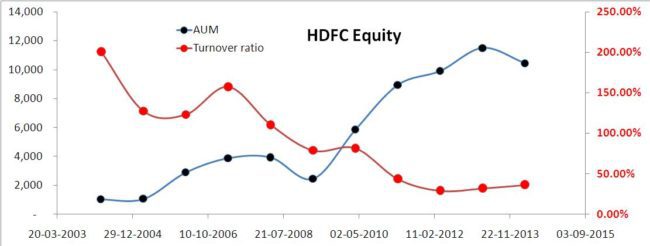
 Observations
🔥Secure your future with our Robo-advisory tool trusted by over 3,000 investors and advisors. From effortless retirement planning to funding your children’s biggest dreams, turn your financial goals into reality. 🔥
Subscribe for money management solutions via email! (Link takes you to our email sign-up form) Join 32,000+ readers in our community.
👉 New Tool Alert! NaviPlan: A Privacy-Focused Multi-asset Tracker and Goal Planner 👈
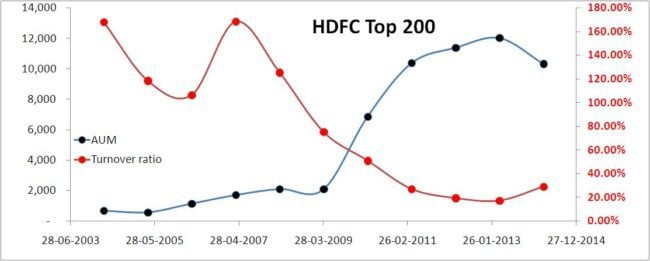
- AUM of both funds grew large only after the 2008 crash and much of it came after the recovery.
- On 31st May 2009, HDFC Equity had AUM of ~ 3780 Crores, and HDFC Top 200, AUM of 3314 Crores. The Sensex recovered from the 2008 crash on June 12 2009 (see graph here).
- In the next 10 months, the AUM of HDFC equity swelled by ~ 51% and that of Top 200 by a whopping ~ 86%
- This information is key to understanding why so many people think both funds have unperformed. Investors who contributed to a massive increase in AUM completely missed the rally after the 2008 crash!
- Ask yourself, among all the investors who are disappointed with both funds, how many would be among those missed the party? If I wanted to enjoy a party, did not have the discipline to plan for it and went late, what right do I have to expect a 7 course meal?
- My point is, a good percentage of disappointed investors is likely to be those who invested quite recently. Remember equity investing is a long-term game and 4 years are too short a time to make any conclusions.
- Now let us focus on the portfolio turnover ratios. Quite disturbingly, the turnover ratio has decreased with an increase in AUM. Does this mean that the fund manager is not able to buy and sell stocks because of large AUM? Is that the reason why the funds have underperformed? Poor liquidity?
- Fair question. This is what Prashant Jain, the fund manager has to say to Forbes Magazine
“You guys are making a big deal about size. Internationally, these kinds of situations arise when the size of a fund reaches say 1% of the market. Why should I get worked up about size when my fund is around 0.12% of the market? The Indian markets are growing and as the size of my fund grows, the market will be even bigger,”
- This was in Aug. 2010. The same article states,
“According to Mercer, a firm that guides international investors on how to invest in the India markets, 95% of both HDFC’s Top 200 and HDFC Equity Fund can be liquidated within ten days. On average, the same number is 85% for other funds in similar categories. Jain achieved this by ensuring mid-caps never exceed a third of the total assets”
- The number should have changed by now. Don’t know where to find current liquidity levels. Even if we assume that presently the fund can be liquidated in about 20 days, I would think that is reasonable.
- The point is, although Jain may not agree, size does have a significant effect on turnover ratios. Here is how the turnover ratios of all funds with AUM greater than 1000 Crores are distributed (Source VR online)
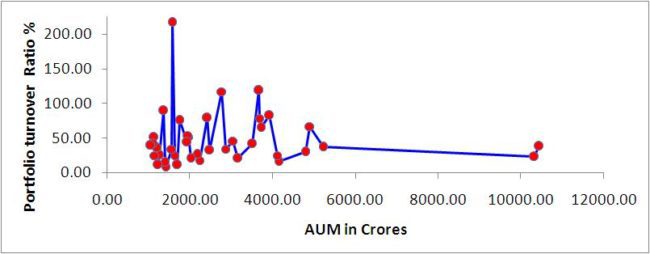
- No prices for guessing which funds the two data points on the extreme right correspond to! While some funds with low AUM choose to have low turnover ratio by choice and style, I think options become limited with increase in AUM and one will have to settle for a low turnover ratio.
- So larger the AUM, smaller the mid-cap and small-cap exposure to ensure reasonable liquidity.
- Jain’s 0.12% argument is not convincing to me. If at 0.12% of the market size the fund has such a poor turnover ratio, what would it be it if its gets to 0.2% or o.3%, let alone 1%. Let us not forget he is the face of HDFC MF and so we cannot take everything he says seriously.
- That said, low turnover ratio or high, what matters is the quality of stocks in the folio. If they are solid ones then they can be held on to for long periods of time.
- In an interview to MorningStar, Jain said,
“Liquidity in large funds is in many ways easier to handle as there is typically a large allocation to large caps and also the investor concentration is not there/less than in smaller funds. Regarding size, I try not to focus on things that are not in my control but want to give the best I can in any situation that I am in”.
The key question is, does large AUM and therefore low turnover ratio result in a drop in performance. To study this, first we assume that before Mar. 31st 2009, HDFC Equity and HDFC Top 200 were ‘small funds’ and after this date, rapidly grew in size to become ‘large funds’. Second, we will need to understand what a rolling return is.
A rolling return when calculated for a fund and its benchmark allows you to evaluate how consistent the fund has been in outperforming its benchmark. To calculate rolling returns, we need to again decide a start-date and end-date. Let us say this is a 10 month period. We then calculate the percentage change in the funds NAV from day 1 (start-date) to day 7 (weekly return or IRR). We then calculate the weekly return from day 2 to day 8, day 3 to day 9 and so on until we reach the last date. We repeat this exercise for the benchmark as well. Learn more about this here.
Thus, the duration over which we evaluate the return rolls over or moves! The duration can be just about anything. Weeks, months, years etc. For equity mutual funds, I prefer years, and I generally do not take any duration less than 3 years seriously. See here for reviews of Top 200, Franklin Blue Chip Equity, Reliance Growth and Quantum Long Term Equity based on rolling returns analysis. For the present situation, let us look at 5-Y, 4-Y, 3-Y, 2-Y and 1-Y rolling returns of HDFC Equity with its benchmark the CNX 500. Let us start with the 5Y rolling return (absolute).  The AUM is plotted on the right axis. The vertical blue line separates the small fund region (left) from the large fund region (right). The dates correspond to the date of investment.
That is if I have invested a sum on 31st Mar 2004 (left-most point of the graph), then 5 years later, I would have got a return (CAGR calculated by XIRR) of 11% So all the data points to the left of the blue line corresponds to investments made when HDFC Equity was a small fund.
All data points to the right of the blue line corresponds to investments made when HDFC Equity was on its way to becoming a large fund. Therefore, when you look at 5-year returns no investments were made in the large fund region and therefore we have no idea how such investments would perform over this time-frame! Now let us count down the time-frame and look at 4-year rolling returns 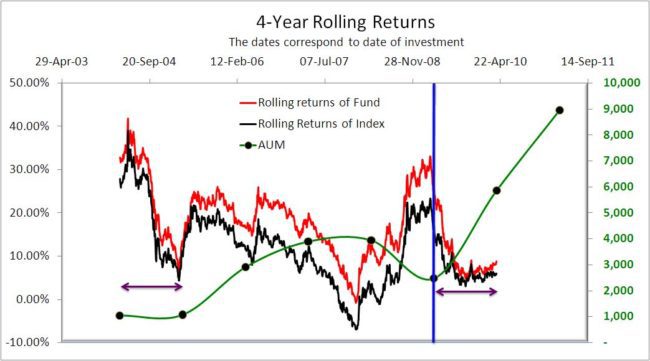 Now we have some investments made in the large fund region (right of the blue line). So can we now look at the graph and conclude that all such investments have relatively underperformed?
Not so fast. The width of this segment is marked by the horizontal arrow. Notice I can place the same arrow in the small fund region and you can see that the fund had a similar level of performance there too. So again, there is not enough data to say anything either way. On with the count-down. The 3-year rolling returns 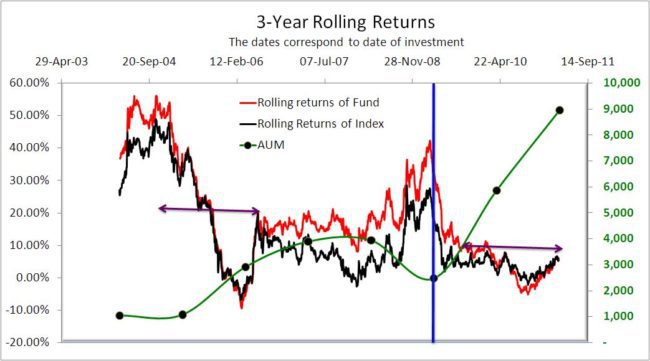 At least now can we say that investments made in the large fund region have underperformed? Well I for one cannot, because the length of the arrows on either side of the blue line are identical.
When investments made during a bull run (2004-2006; small fund regime) in HDFC Equity have not fared any better than its index (CNX 500) why should investments made in the large fund regime fare any better when the market has been sideways?
My point is, the role of the fund manager, his convictions and choices have played a much bigger role than AUM size . During the bull run Jain chose to stay away from certain sectors like infrastructure (read his interview here). Similar observations can be made from the 2Y and 1Y (below) rolling returns.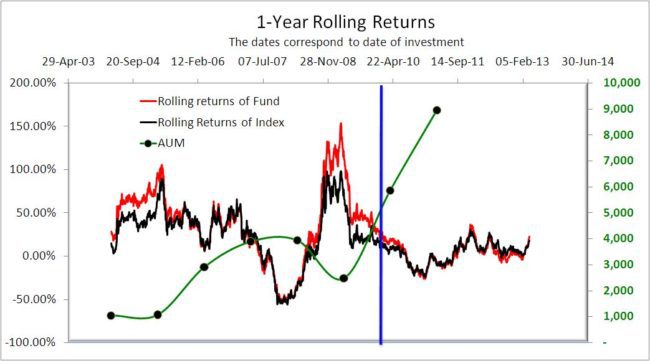 There is obviously no need for drawing any arrows here!
Here is the key question: Can we assume high AUM implies low portfolio turnover ratio and therefore poor performance?
When high turnover ratio does not always result in a good performance (that is beating the benchmark) and when the period of poor performance in the small fund regime matches the period in the large regime (at least thus far), how can we assume (forget about proving it) large AUM implies poor performance? There is absolutely no proof of that so far.
I am not saying AUM does not affect performance. I am saying with respect to HDFC Equity (and perhaps with Top 200) there is no evidence of it thus far. The market is too complex a creature to make such straightforward assumptions, especially when there is no concrete evidence.
I am willing to bet that people who attribute the underperformance to size (at least with respect to these two fund) are clueless about how compounding in equity instruments work.
Perhaps down the line size will impact these two funds. My point is it remains to be seen and nothing can be concluded either way based on the available data.
Perhaps you are understandably disappointed with these conclusions and find them boring. Well, the truth often is!
What now? I hold positions in both HDFC Top 200 (sons education) and HDFC Equity (retirement) and I invested in the large fund regime.
Returns were low for quite a while but both funds have impressively responded to this rally. As of now the returns from both funds have exceed my expectations. I see no reason to quit these funds as of now.
It all comes to expectations. Most people who invest in HDFC Equity and HDFC Top 200 do not understand why they are considered good funds. These funds have pretty beat their benchmarks 100% of the time if held for at least 5 years.
So one must cut them that much slack. Looking at short-term performance and jumping up and down complaining about AUM when there is no evidence of that short-term or long-term is just childishness.

Join 32,000+ readers and get free money management solutions delivered to your inbox! Subscribe to get posts via email! (Link takes you to our email sign-up form)
🔥You can also avail massive discounts on our courses and the freefincal investor circle! 🔥& join our community of 8000+ users!
Track your mutual funds and stock investments with this Google Sheet!
We also publish monthly equity mutual funds, debt and hybrid mutual funds, index funds, and ETF screeners, as well as momentum and low-volatility stock screeners.
You can follow our articles on Google News

We have over 1,000 videos on YouTube!

Join our WhatsApp Channel


- Do you have a comment about the above article? Reach out to us on Twitter: @freefincal or @pattufreefincal
- Have a question? Subscribe to our newsletter using the form below.
- Hit 'reply' to any email from us! We do not offer personalised investment advice. We can write a detailed article without mentioning your name if you have a generic question.
Join 32,000+ readers and get free money management solutions delivered to your inbox! Subscribe to get posts via email! (Link takes you to our email sign-up form)
About The Author
Dr M. Pattabiraman (PhD) is the founder, managing editor and primary author of freefincal. He is an associate professor at the Indian Institute of Technology, Madras. He has over 14 years of experience publishing news analysis, research and financial product development. Connect with him via Twitter(X), LinkedIn, or YouTube. Pattabiraman has co-authored three print books: (1) You can be rich too with goal-based investing (CNBC TV18) for DIY investors. (2) Gamechanger for young earners. (3) Chinchu Gets a Superpower! for kids. He has also written seven other free e-books on various money management topics. He is a patron and co-founder of “Fee-only India,” an organisation promoting unbiased, commission-free, AUM-independent investment advice.
Our flagship course! Learn to manage your portfolio like a pro to achieve your goals regardless of market conditions! ⇐ More than 3,500 investors and advisors are part of our exclusive community! Get clarity on how to plan for your goals and achieve the necessary corpus no matter the market condition!! Watch the first lecture for free! One-time payment! No recurring fees! Life-long access to videos! Reduce fear, uncertainty and doubt while investing! Learn how to plan for your goals before and after retirement with confidence.
Increase your income by getting people to pay for your skills! ⇐ More than 800 salaried employees, entrepreneurs and financial advisors are part of our exclusive community! Learn how to get people to pay for your skills! Whether you are a professional or small business owner seeking more clients through online visibility, or a salaried individual looking for a side income or passive income, we will show you how to achieve this by showcasing your skills and building a community that trusts and pays you. (watch 1st lecture for free). One-time payment! No recurring fees! Life-long access to videos!
Our book for kids: “Chinchu Gets a Superpower!” is now available!


Must-read book even for adults! This is something that every parent should teach their kids right from their young age. The importance of money management and decision making based on their wants and needs. Very nicely written in simple terms. - Arun.Buy the book: Chinchu gets a superpower for your child!
How to profit from content writing: Our new ebook is for those interested in getting a side income via content writing. It is available at a 50% discount for Rs. 500 only!
Do you want to check if the market is overvalued or undervalued? Use our market valuation tool (it will work with any index!), or get the Tactical Buy/Sell timing tool!
We publish monthly mutual fund screeners and momentum, low-volatility stock screeners.
About freefincal & its content policy. Freefincal is a News Media organisation dedicated to providing original analysis, reports, reviews and insights on mutual funds, stocks, investing, retirement and personal finance developments. We do so without conflict of interest and bias. Follow us on Google News. Freefincal serves more than three million readers a year (5 million page views) with articles based only on factual information and detailed analysis by its authors. All statements made will be verified with credible and knowledgeable sources before publication. Freefincal does not publish paid articles, promotions, PR, satire or opinions without data. All opinions will be inferences backed by verifiable, reproducible evidence/data. Contact Information: To get in touch, please use our contact form. (Sponsored posts or paid collaborations will not be entertained.)
Connect with us on social media
- Twitter @freefincal
- Subscribe to our YouTube Videos
- Posts feed via Feedburner.
Our publications
You Can Be Rich Too with Goal-Based Investing
 Published by CNBC TV18, this book is designed to help you ask the right questions and find the correct answers. Additionally, it comes with nine online calculators, allowing you to create custom solutions tailored to your lifestyle. Get it now.
Gamechanger: Forget Startups, Join Corporate & Still Live the Rich Life You Want
 This book is designed for young earners to get their basics right from the start! It will also help you travel to exotic places at a low cost! Get it or gift it to a young earner.
Your Ultimate Guide to Travel
 This is an in-depth exploration of vacation planning, including finding affordable flights, budget accommodations, and practical travel tips. It also examines the benefits of travelling slowly, both financially and psychologically, with links to relevant web pages and guidance at every step. Get the PDF for Rs 300 (instant download)