Last Updated on December 30, 2015 at 2:32 pm
The standard deviation is the simplest way of measuring volatility of an instrument. For investors, it is, the most important risk measure they should be aware of while choosing product categories. It is in my opinion, the key to successful mutual fund investing and can help you select mutual fund categories suitable for your financial goals
When you calculate returns of a volatile instrument, each week, each month, or each year, it will fluctuate up and down. You can easily determine the average return over a given period. However, the individual entries can deviate from this returns. The average of such deviations, is the standard deviation. It is defined such that it is always positive, while returns can be positive or negative.
For example, if the average annual return of an equity fund over the last 10Y years, is 18%, it is tempting to expect such returns when you wish to invest in such equity funds.
However, the standard deviation tells you how much the actual return has varied from the average return.
🔥Secure your future with our Robo-advisory tool trusted by over 3,500 investors and advisors. From effortless retirement planning to funding your children’s biggest dreams, turn your financial goals into reality. 🔥
Subscribe for money management solutions via email! (Link takes you to our email sign-up form) Join 32,000+ readers in our community.
👉 New Tool Alert! NaviPlan: A Privacy-Focused Multi-asset Tracker and Goal Planner 👈
Say, the standard deviation is 5%.
This means, in the past 10Y, the return is 18% +/- 5%. That is the standard deviation is defined as the error in the average return.
This definition assumes that the data points obey what is called a normal distribution or a bell curve. This is not often true. However, the standard deviation is still a simple measure of, ‘how much returns can fluctuate’.
Investors should determine the standard deviation of the instrument that they have in mind. Knowledge of this will prevent them from making wrong choices.
For example, the standard deviation of an equity fund over the last 5Y period is 20% and the standard deviation is 12%. This means, the error in the average is comparable to the average. Meaning, that if we invest in equity for short durations, it is a gamble. The result can turn out to be anything.
If I want to invest for say, 5 years, and wish to choose a particular instrument which is volatile, I must have an idea how much the returns of the instrument can fluctuate over 5 years.
For this, I need to know the 5Y rolling return data – which can be obtained with this Excel sheet and
I need the rolling standard deviation data – which can be obtained with this Excel sheet.
This then gives mean an idea of how much returns can fluctuate and whether it is worth the risk.
However, doing this can be pain. I don’t want to do this, I dont have much choice to expect what is available.
I can only find standard deviation listed for all funds in tabular form at VR online. I am assuming that this is for the last 3Y period (on trailing basis) – VR does not say and does not bother to respond.
Morning Star clearly mentions duration over which standard deviation is computed but does not provide it in tabular format.
So we will have to make do with the VR data which we shall assume is for 3 years.
Here is a chart of the minimum and maximum standard deviations found for each of the equity mutual fund categories at VR.
This forms a sort of risk ladder which one can use to understand how much funds in each categories can fluctuate and how much there is overlap in volatility.
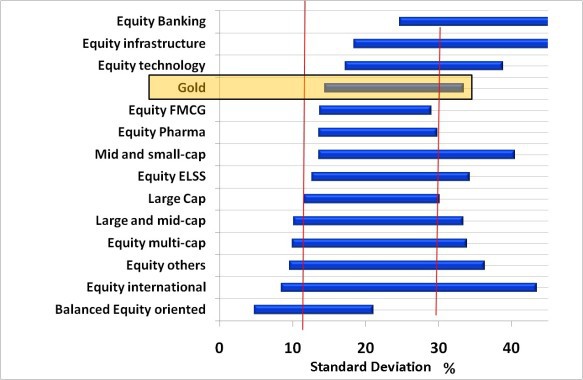
- Gold is highlighted to point out that it is as risky as equity but returns like debt before tax
- The red vertical lines are guides referenced to large caps.
- Notice that much of the risk associated with equity-oriented balanced funds overlaps with equity funds. I wish people stop recommending them to those new to equity investing. It will not help much, unless some makes a conscious choice to pick the one with lowest standard deviation, unmindful of returns.
- Pharma and FMCG sectors are as volatile as large-caps. Can someone educate me why?
- The other sectors are more volatile. Banking is nuts!
- I should have marked the category averages there, but was too lazy.
- International equity is all over the place because of current fluctuations. Read more: Portfolio diversification with international stocks
- Notice ELSS volatility is pretty much similar to that of large caps
- Notice the additional risk that mid and small-cap funds take over large caps. The additional risk could result in higher returns but at much higher investor stress.
- Equity multi-cap and large/mid-cap fund categories spread out on either side of the large caps. For some funds, the lower standard deviation could be because of diversification and poor correlation among the portfolio stocks. Holding one fund in such a category is enough to represent an equity folio. Of course, one will have to be careful about the fund strategy and check other parameters like downside protection.
Will try and post a similar chart for debt funds and see if I can combine all fund categories together.
One can also plot the min and max return along with min and max standard deviation. However, we would be dealing only with data over 3 years. Which is not representative. If only I could get such data for last 10 years!
Although I do not expect the above risk ladder to change much, long-returns would be more reliable.
Announcement: Non-intrusive Ads from Wordads (a segment of wordpress.com) have been turned on throughout the blog as an experiment. We all hate ads. Unfortunately, they are a necessary evil. Freefincal is growing and the ad revenue will enable better hosting, better features and deeper analytics on making it better. If the quality of ads is poor (they should be better than Adsense), they will be promptly removed. Thank you for understanding.