Last Updated on September 23, 2020 at 5:12 pm
I am doing a series on portfolio management strategies in the hope that it would lead to some Excel tools for the same. In the first part on portfolio diversification, we looked at correlations between equity and debt, equity and gold, large cap and mid/small cap.
In this post, let us consider the correlation between Indian stocks and international stocks.
CNX 500 vs S&P 500(US)
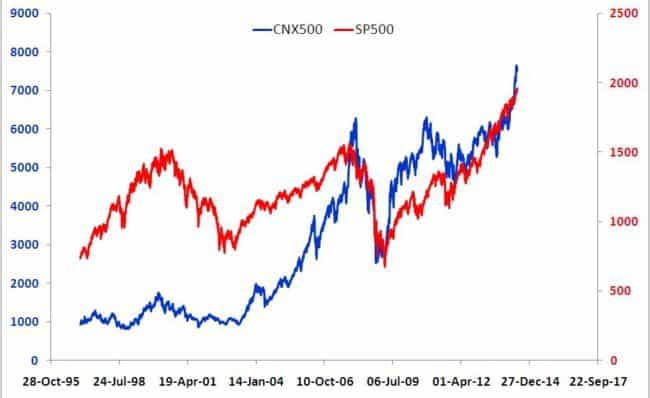
Let us first compare the Indian broad-based index, CNX 500, with S&P 500 a large cap index of 500 US stocks. The correspondence between the indices may be far from perfect but is good enough for our purposes.
🔥Secure your future with our Robo-advisory tool trusted by over 3,500 investors and advisors. From effortless retirement planning to funding your children’s biggest dreams, turn your financial goals into reality. 🔥
Subscribe for money management solutions via email! (Link takes you to our email sign-up form) Join 32,000+ readers in our community.
👉 New Tool Alert! NaviPlan: A Privacy-Focused Multi-asset Tracker and Goal Planner 👈
The correlation coefficient for these two indices is only 0.57.
The correlation between six-month returns is 0.52.Thus only 27% (0.52 x 0.52 = R-squared) of the returns are correlated.
Thus, on the face of this evidence, it makes a lot of sense to allocate a ‘small’ portion of the portfolio to US stocks!
Wait a minute! What about currency risk?
Yes, currency exchange rate is a crucial component of investing in international stocks. We shall consider currency risk after we look at a couple of indices.
CNX 500 vs S&P 350 (Europe)
“The S&P Europe 350® is an equity index drawn from 17 major European markets, covering approximately 70% of the region’s market capitalization.” –us.spindices.com
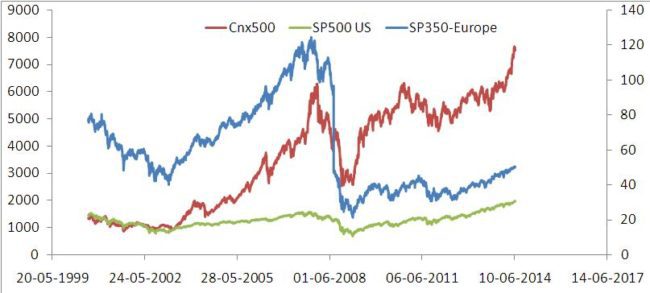
Between 28 July 2000 and 20th June 2014, the correlation between CNX 500 and S& P 350 six-month returns is 0.71. Thus 51% (0.71 x 0.71 = R-squared) of the returns are correlated.
Therefore, can we safely add some European stocks in our folio?
What about the correlation between US and European stocks? That is important if I already have US stocks in the folio.
For the same duration, the correlation between six month returns of S&P500 (US) and S&P 350 (Europe) is 0.88. Thus a good 79% (0.88 x 0.88 = R-squared) of the returns are correlated.
So the moment we have 3 different types of stocks, be it from different regions as here, or of different market cap (as seen in part I), we have a problem.
It is not easy to decide how much of each type should be in the folio.
We have what is known as a correlation matrix
CNX 500 | S&P 500 | S&P 350 | |
CNX 500 | 1 | 0.59 | 0.71 |
S&P 500 | 0.59 | 1 | 0.88 |
S&P 350 | 0.71 | 0.88 | 1 |
It is easy to understand why the diagonal entries are all ‘1’. The correlation of an index with itself must be ‘1’!
We will consider such matrices in the future and learn how to construct optimized portfolios with them.
For the moment the message is, stocks from different regions across the globe are poorly correlated. This means that by including international stocks in the portfolio, the overall diversification should improve and the volatility will be lowered.
For example, when we had a sideways market just a little while ago, Sensex increased only by 2.6% bet Dec. 11 2009 to Aug. 31st, 2012, the S&P 500 increased by approximately 29%.
So folios with US stocks in them would have fared much better than those with only Indian stocks.
This is because of the poor correlation between the two markets. Although individually US and Indian stocks are risky, as part of a well diversified folio, they bring the down the overall risk.
This is the key concept behind diversification. Risky securities poorly correlated with each other result in a less risky portfolio.
Let us find out if this statement holds true under more rigorous backing testing, taking into account, currency risk.
Before we do that, CNX 500 has correlation 0.93 with MSCI Asia (excluding Japan) – it is a mix of securities from China, Hong Kong, India, Indonesia, Korea, Malaysia, Philippines, Singapore, Taiwan, and Thailand. Thus, about 88% returns are correlated.
Other MSCI indices can be tracked from here
Read this paper for more data on correlations among indices the world over.
Currency Risk
The following discussion is based on, Modern Portfolio Theory & Investment Analysis, by E. J. Elton, M. J. Gruber, S. J. Brown and W N. Goetzmann
To understand currency risk, let us consider a US investor and an Indian investor who buy the same US stock at a price of 40 USD. To keep things simple, let us ignore expenses involved in this purchase for both parties.
After 1 year, the stock price is 50 USD.
The return for the US investor (RUS) can be calculated from
50 = 40 x (1+ RUS) or
1+RUS = (50/40)
RUS = 25%
The return for the Indian investor (RIndian) would depend on the exchange rate at the time of purchase and time of redemption (or valuation)
If the rate was Rs. 45 per dollar during purchase and Rs. 55 per dollar after an year,
(55 x 50) = (45 x 40) x (1+ RIndian) or
1+RIndian = (55 x 50)/ (45 x 40) = (55/45) x ( 50/40)
RIndian =52.8%
Here (55/45) = 1+RX (this gives the % change in the currency rate or the exchange return)
(50/40) = 1+ RUS (the % change in the stock price as above)
1+RIndian = (1+ RUS) x (1+RX)
Notice that the return for the Indian investor, depends on, RX, the exchange return.
In the above case, exchange rate at the time of valuation is higher than the rate upon purchase.
Therefore, the Indian investor would have obtained a higher return than the US investor would.
If the exchange rate had decreased, the Indian investor would have obtained a lower return that his/her US counterpart.
For example, if the rate was Rs. 55 per dollar during purchase and Rs. 45 per dollar after an year,
1+RIndian = (45 x 50)/ (55 x 40) = (45/55) x ( 50/40)
RIndian = 2.27%
Notice the extraordinary difference in returns due to currency fluctuations alone!
Thus, the exchange rate determines the quantum of return. This additional source of volatility is known as currency risk.
Indian citizen investing in US stocks
Let us understand how this risk plays out for an Indian investor who wish to hold US stocks. For this study we,
- consider historical monthly exchange rates from here
- shall use monthly MSCI US index data. “The MSCI USA Index is designed to measure the performance of the large and mid cap segments of the US market. With 609 constituents, the index covers approximately 85% of the free float-adjusted market capitalization in the US” – msci.com
- shall compute 1-year and 10-year rolling returns
1-year rolling returns
US citizen investing in US stocks: average return = 8.5%; standard deviation (risk) = 17.2%
Indian citizen investing in US stocks: average return = 14.6%; standard deviation (risk) = 21.3%
The extra risk for the Indian investor originates from the volatility in the exchange rate.
Is the Indian investor is taking on more risk by investing in US stocks?
The average 1Y return for the BSE Mid-Cap is 22%; standard deviation (risk) = 41%
Thus compared to Indian mid-cap stocks, the risk for the Indian investor in US stocks over a period of 1 year is close to 50% lower!
10-year rolling returns
US citizen investing in US stocks: average return = 8.3%; standard deviation (risk) = 4.9%
Indian citizen investing in US stocks: average return = 15%; standard deviation (risk) = 9.1%
Again, the extra risk for the Indian investor originates in the volatility in the exchange rate
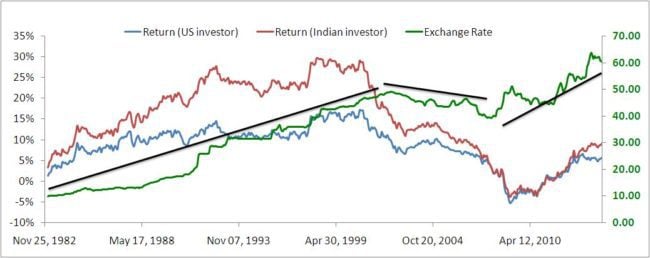
Notice how the Indian investor got more returns than the US investor when the exchange rate kept increasing (leftmost black line). When the increase reversed (middle black line), returns for the Indian investor, sharply fell down.
The average 10Y return for the BSE Mid-Cap is 14.4%; standard deviation (risk) = 3.1%
Therefore, this implies that over longer periods, the risk associated with investing in US stocks is about 3 times higher (9.1% vs 3.1%) for the Indian investor compared to an investment in regional (Indian) stocks.
This is again due to the exchange rate risk.
I find this statistic troubling. I will need to dig around more to understand more
US citizen investing in Indian stocks
Let us understand how this risk plays out for a US investor who wish to hold Indian stocks. For this study we,
- consider historical monthly exchange rates from here
- shall use monthly MSCI India index data. “The MSCI India Index is designed to measure the performance of the large and mid cap segments of the Indian market. With 69 constituents, the index covers approximately 85% of the Indian equity universe.” – msci.com
- shall compute 10-year rolling returns
10-year rolling returns
Indian citizen investing in Indian stocks: average return = 11.1%; standard deviation (risk) = 6.1%
US citizen investing in Indian stocks: average return = 9.2%; standard deviation (risk) = 7.3%
Had the US investor put money in the MSCI USA index, he would have got an average return of 8.3%; standard deviation (risk) = 4.9% (as mentioned above)
Thus, the US investor also faces a higher risk by investing in Indian stocks. However, the risk is still less than 2 times (7.3% vs 4.9%) compared to an investment in regional (US) stocks.
The exchange risk affects the Indian investor in US stocks much more than the US investor in Indian stocks.
As mentioned earlier, I find this statistic troubling.
The key questions are,
Does international diversification lower overall portfolio risk without improving returns? Or, does it provide higher portfolio returns at higher risk?
Technically speaking, we are yet to answer these questions. We will need to perform an efficient frontier analysis to answer this question. I am trying to develop an automated Excel sheet for this. Therefore, we will consider this question in the coming weeks.
My Take: I have always believed in diversification through international equity. It is nothing more than a belief for me as it ‘seemed’ to make sense.
About 4% of my retirement folio consists of international equity, a little more than 1% of which is US stocks (FT US feeder fund) and rest from PPFAS Long Term Value Fund (LTVF).
Thus, it is too small, and I have not held them long enough to tell if it has made a difference to my portfolio.
While I am certainly not going to reduce my international equity allocation to zero, I am also not in a flaming hurry to increase it either. I will wait until I get the efficient frontier analysis tool ready and answer the above questions.
I recently posted on risk adjusted return numbers for PPFAS LTVF and found that risk was considerably lower than the CNX 500, which is most likely to arise from its well-diversified portfolio with international stocks.
Meanwhile, if you are convinced about holding a small percentage of international equity, funds like Templeton India Equity Income and/or PPFAS LTVF provide good international equity exposure with tax-free long term capital gains, since they contain more than 65% Indian equity, unlike feeder funds, which are taxed like debt funds.
Apologies for being inconclusive about diversification with international stocks. Unfortunately it requires further analysis.
In the next part of this portfolio diversification series, we will consider correlation among sectors.