Last Updated on May 30, 2016 at 1:41 pm
Survival is a human instinct. The memorable line from Jurassic Park, “life will find a way!”, is relevant not only to all living organisms but also to pretty much everything that we humans do.
Diversification in general, is something that we do by instinct.
We do not fill our wardrobes with only cotton-wear or with only woollen-wear because we do not want to risk wearing the wrong clothes at the wrong time of the year.
The grocer never fills his shop with the same item because he/she does not want to risk losing a steady stream of income by selling the same item which may not have the same demand every day of the month.
🔥Secure your future with our Robo-advisory tool trusted by over 3,000 investors and advisors. From effortless retirement planning to funding your children’s biggest dreams, turn your financial goals into reality. 🔥
Subscribe for money management solutions via email! (Link takes you to our email sign-up form) Join 32,000+ readers in our community.
👉 New Tool Alert! NaviPlan: A Privacy-Focused Multi-asset Tracker and Goal Planner 👈
The underlying idea is clean and simple: we diversify to mitigate risk. It is a survival instinct imbibed in each of us.
Yet, it is baffling that when it comes to investing, very, very few investors diversify their portfolio.
In my opinion, the main reasons behind this, are
- constantly chasing after returns by looking at short-term performance.
- abject refusal to concentrate on the net portfolio returns and an obsession with individual performance.
Why diversify?
- Reduce portfolio volatility
- Get better returns with lower risk
Benefits of diversification will take time to appear. So one needs to give it time.
How to diversify?
Let us consider an unrealistic and naïve example, commission-based selling.
An insurance agent sells endowment policies and also distributes mutual funds.
When there is a stock bull run, he notices sale of diversified equity mutual funds increase (most often after the major rally!).
When there is prolonged sideways market, people tend to buy pension plans and child plans more!
As far as the agent is concerned, mutual funds sales and endowment plan sales, peak at different points of time. That is the sales movement is poorly correlated.
There are risks associated with selling mutual funds and there are risks associated with selling endowment plans.
However, since their sales movement (and therefore risks) is poorly correlated, the fluctuations in the insurance agent’s income is reduced.
That is the agent receives a steady income irrespective of marker conditions compared to sale of mutual funds alone or endowment plans alone.
This is simple commonsense, it is not? Diversify your sales with unrelated products and steady the income stream.
Every action has an associated negative element or risk. The idea is to choose actions with uncorrelated risk. Thus if one fails, chances are the other won’t, and vice-versa. Thus by reducing the chance of both actions failing together, we can reduce the overall risk.
When it comes to investing, the logic remains the same. We choose asset classes which are poorly correlated with each other. Individually they maybe volatile.
However, since their movements are poorly correlated, the overall volatility is lowered.
This may seem counterintuitive. We add volatile, but poorly correlated instruments to reduce overall volatility!
Thus measuring correlation is key to quantifying portfolio diversification.
How to measure correlation?
There is a simple and straightforward way to estimate the correlation between two instruments (from the same or different asset class) – Correlation Coefficient
The square of the correlation coefficient is referred to as R-squared and might be more familiar.
R-squared between an index fund and associated benchmark will ideally be 1. That is, 100% of the index funds returns stem from the benchmarks movement.
R-squared between a large cap fund and associated benchmark will be close to 1. (0.85 -0.99). That is, 85-99% of the funds returns stem from the benchmarks movement.
Many investors have 2-3 large cap funds in the hope to diversifying and reducing risk. However, if the funds are indexed to the same benchmark with identical R-squared, there will absolutely be no benefit from holding the second or third large-cap fund!
See the Value Research list of large cap funds for examples R-squared.
Since the R-squared is always positive, it does not provide information about the nature of the correlation: whether it is
- positive (two assets classes move in step – peaks and dips coincide) or
- negative (two asset classes move out of step – peak in one coincide with dip in another)
This where the correlation coefficient steps in.
Diversification among asset classes
You must have heard the refrain, ‘diversify across equity, debt and gold’.
Why do you think they say so?
Equity vs Bonds
Have a look at the CNX 500 plotted with the 10-Ygovernment bond yield

There are regions where they move in step and regions where they move out of step. The correlation coefficient between the indices for the duration shown above (4th Jan 1999 to 23rd Jan 2014) is -0.10.
This indicates that equity and bonds have very little correlation with each other. I choose not to write negative correlation because, the correlation coefficient is a strong function of both the duration and the quantity used for calculating.
If we choose 6 months returns instead of the indices, the correlation coefficient would be 0.05. If we used 4 months or 12 months return, the answer will be very different.
So let us not pay too much attention to the sign or actual number and simply note that the correlation coefficient is much less than 1.
This is a good enough reason to diversify a portfolio with equity and debt (long term gilt funds in this case) for a long term goal in general.
The percentage allocation the would depend on duration. So would the nature of the debt instrument.
Equity vs Gold
The 15 year rolling CAGR for gold and the US broad index, S&P 500 is plotted below. The idea of negative correlation between asset classes can be understood by observing this plot.
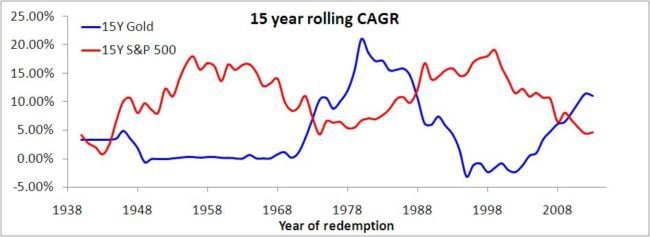
Notice how equity returns peak when gold returns dip and vice-versa.
The correlation coefficient for the above data is -0.52. The square of this, the R-squared is 0.27. That is only 27% of the returns are correlated. The rest is entirely independent of each other.
This is a very good example of negative correlation of two highly risk assets.
Yes! Gold is riskier than stocks!
The average 15-year CAGR for stocks is 11% with a standard deviation of 4.6%
The average 15-year CAGR for gold is 4.6% with a standard deviation of 5.97%.
The standard deviation is a measure of deviations from the average. So higher the value, higher the deviation, and higher the risk.
A standard deviation higher than the average implies, long term gold returns can just about be anything!! Negative or positive!
Gold and Stocks may be a good example of negative correlation between asset classes, but that does not mean gold is a good candidate for diversification.
The risk associated with investing in gold is higher the average return before taxes! Not worth it!
How about bonds?
The average 10-year bond yield between 4th Jan 1999 to 23rd Jan 2014 is 8.1%. The standard deviation is only 1.7%
Therefore, reasonable reward with low risk, making them very good candidates for diversification.
Diversification within an asset class
People talk of a ‘core’ portfolio consisting of large caps and a ‘satellite’ portfolio consisting of small and mid-caps. Here is why.
Large Cap vs Mid Cap
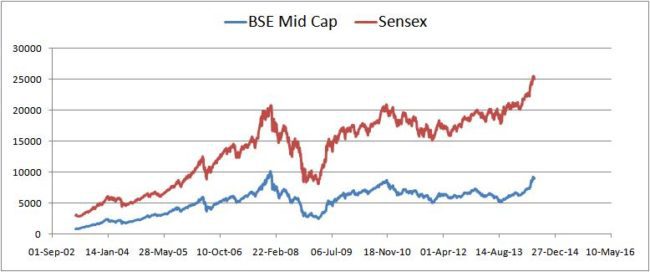
Just by visual observation one can tell that the correlation is high. Indeed the correlation coefficient is 0.94!
This is how the 1-year rolling returns look
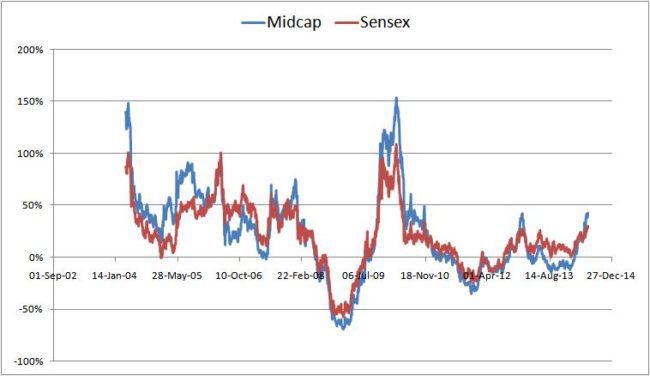
The correlation coefficient of the return is 0.93. An R-squared of 0.86. That is 86% of the return movement is correlated.
Large Cap vs. Small Cap
1-year rolling returns are plotted below.
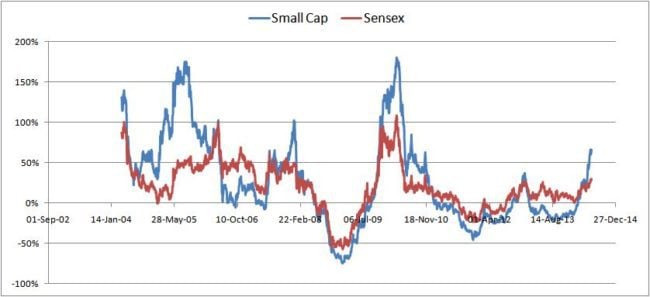
The correlation between small cap and large cap is much lower, 0.81. The R-squared is 0.65. So only 65% of the return movement is correlated.
What should we do while diversifying? What should be the large:mid:small cap ratio?
- 60:20:20
- 33:33:33
- 50:25:25
- etc.
The risk associated with large caps is relative the lowest. For example, between 1st April 2003 to 20th June 2013, the average 1Y return of,
BSE Sensex: 21% . Standard deviation: 29% (low risk)
BSE Mid Cap: 22% . Standard deviation: 41% (medium risk)
BSE Small Cap: 27% . Standard deviation: 54% (high risk)
Hence it makes sense to have something like (large:mid:small cap ratio)
- 50:30:20 or
- 60: 25:15
Any other combination can also be chosen depending on risk appetite.
In the second part of this post, we will consider correlation among sectors and correlation between Indian and international stocks. Soon we will also consider quantitative ways to allocate assets in a portfolio.

Join 32,000+ readers and get free money management solutions delivered to your inbox! Subscribe to get posts via email! (Link takes you to our email sign-up form)
🔥You can also avail massive discounts on our courses and the freefincal investor circle! 🔥& join our community of 8000+ users!
Track your mutual funds and stock investments with this Google Sheet!
We also publish monthly equity mutual funds, debt and hybrid mutual funds, index funds, and ETF screeners, as well as momentum and low-volatility stock screeners.
You can follow our articles on Google News

We have over 1,000 videos on YouTube!

Join our WhatsApp Channel


- Do you have a comment about the above article? Reach out to us on Twitter: @freefincal or @pattufreefincal
- Have a question? Subscribe to our newsletter using the form below.
- Hit 'reply' to any email from us! We do not offer personalised investment advice. We can write a detailed article without mentioning your name if you have a generic question.
Join 32,000+ readers and get free money management solutions delivered to your inbox! Subscribe to get posts via email! (Link takes you to our email sign-up form)
About The Author
Dr M. Pattabiraman (PhD) is the founder, managing editor and primary author of freefincal. He is an associate professor at the Indian Institute of Technology, Madras. He has over 14 years of experience publishing news analysis, research and financial product development. Connect with him via Twitter(X), LinkedIn, or YouTube. Pattabiraman has co-authored three print books: (1) You can be rich too with goal-based investing (CNBC TV18) for DIY investors. (2) Gamechanger for young earners. (3) Chinchu Gets a Superpower! for kids. He has also written seven other free e-books on various money management topics. He is a patron and co-founder of “Fee-only India,” an organisation promoting unbiased, commission-free, AUM-independent investment advice.
Our flagship course! Learn to manage your portfolio like a pro to achieve your goals regardless of market conditions! ⇐ More than 3,500 investors and advisors are part of our exclusive community! Get clarity on how to plan for your goals and achieve the necessary corpus no matter the market condition!! Watch the first lecture for free! One-time payment! No recurring fees! Life-long access to videos! Reduce fear, uncertainty and doubt while investing! Learn how to plan for your goals before and after retirement with confidence.
Increase your income by getting people to pay for your skills! ⇐ More than 800 salaried employees, entrepreneurs and financial advisors are part of our exclusive community! Learn how to get people to pay for your skills! Whether you are a professional or small business owner seeking more clients through online visibility, or a salaried individual looking for a side income or passive income, we will show you how to achieve this by showcasing your skills and building a community that trusts and pays you. (watch 1st lecture for free). One-time payment! No recurring fees! Life-long access to videos!
Our book for kids: “Chinchu Gets a Superpower!” is now available!


Must-read book even for adults! This is something that every parent should teach their kids right from their young age. The importance of money management and decision making based on their wants and needs. Very nicely written in simple terms. - Arun.Buy the book: Chinchu gets a superpower for your child!
How to profit from content writing: Our new ebook is for those interested in getting a side income via content writing. It is available at a 50% discount for Rs. 500 only!
Do you want to check if the market is overvalued or undervalued? Use our market valuation tool (it will work with any index!), or get the Tactical Buy/Sell timing tool!
We publish monthly mutual fund screeners and momentum, low-volatility stock screeners.
About freefincal & its content policy. Freefincal is a News Media organisation dedicated to providing original analysis, reports, reviews and insights on mutual funds, stocks, investing, retirement and personal finance developments. We do so without conflict of interest and bias. Follow us on Google News. Freefincal serves more than three million readers a year (5 million page views) with articles based only on factual information and detailed analysis by its authors. All statements made will be verified with credible and knowledgeable sources before publication. Freefincal does not publish paid articles, promotions, PR, satire or opinions without data. All opinions will be inferences backed by verifiable, reproducible evidence/data. Contact Information: To get in touch, please use our contact form. (Sponsored posts or paid collaborations will not be entertained.)
Connect with us on social media
- Twitter @freefincal
- Subscribe to our YouTube Videos
- Posts feed via Feedburner.
Our publications
You Can Be Rich Too with Goal-Based Investing
 Published by CNBC TV18, this book is designed to help you ask the right questions and find the correct answers. Additionally, it comes with nine online calculators, allowing you to create custom solutions tailored to your lifestyle. Get it now.
Gamechanger: Forget Startups, Join Corporate & Still Live the Rich Life You Want
 This book is designed for young earners to get their basics right from the start! It will also help you travel to exotic places at a low cost! Get it or gift it to a young earner.
Your Ultimate Guide to Travel
 This is an in-depth exploration of vacation planning, including finding affordable flights, budget accommodations, and practical travel tips. It also examines the benefits of travelling slowly, both financially and psychologically, with links to relevant web pages and guidance at every step. Get the PDF for Rs 300 (instant download)