Last Updated on December 18, 2021 at 10:43 pm
Use this Excel sheet to analyze the risk vs. reward of investing in a stock in comparison with an index. The analysis is based on price history (adjusted for dividends, splits and bonuses) and is a spin-off the popular Mutual Fund Risk-return analyzer
Two versions of the sheet are available:
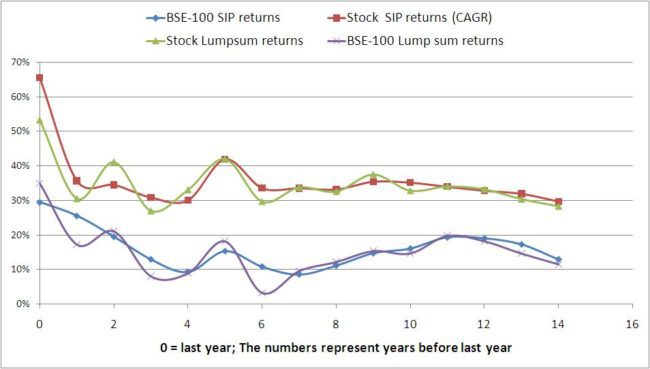
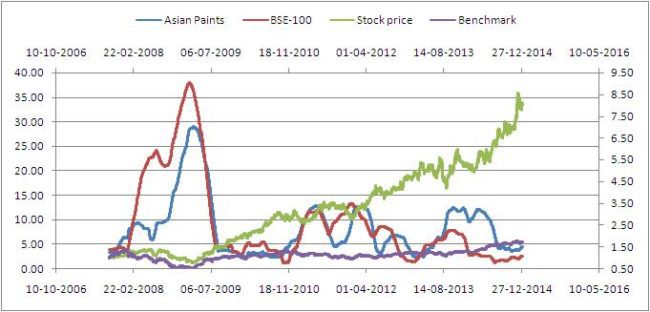
- The ‘annual’ version in which risk and reward metrics are computed for each annual year for the last 8 years and SIP and lump sum returns are calculated for the 15 years (if available of course).
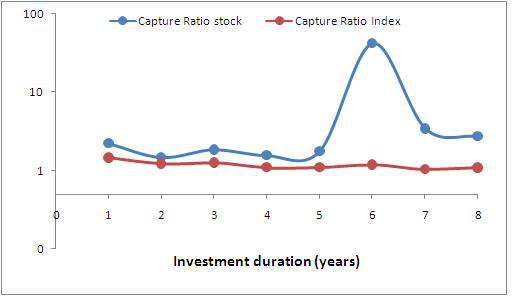
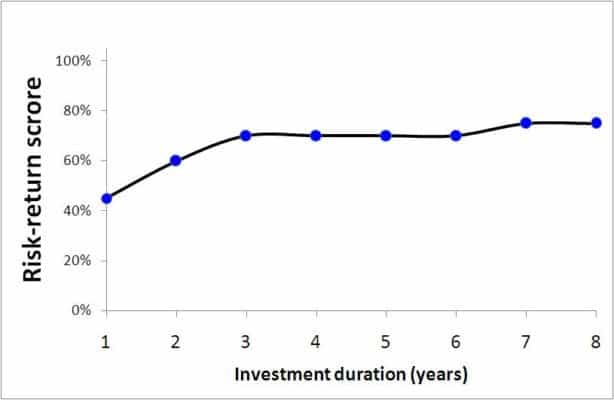
- The ‘investment duration’ version calculates risk and reward metrics for investment durations ranging 1-8 years and SIP and lump sum returns are calculated for durations ranging 1-15 years.
The delievery brokerage is take into account while calculating returns.
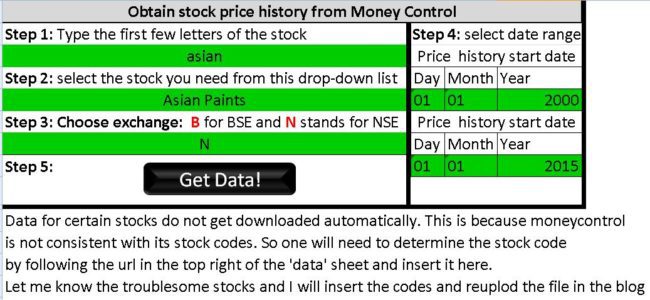
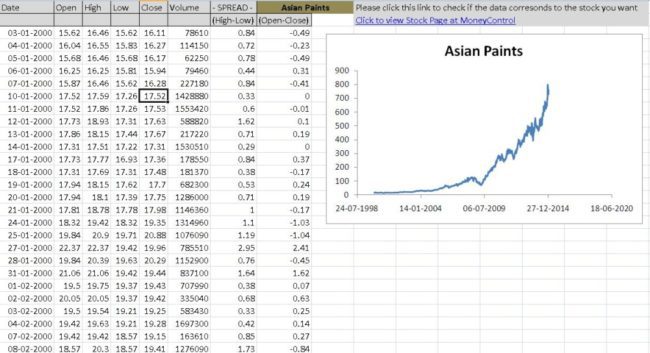
The sheet pulls stock price data from Money Control. The earlier version of the historical stock downloader has now been updated with automatic retrieval of moneycontrol stock codes.
🔥Secure your future with our Robo-advisory tool trusted by over 3,500 investors and advisors. From effortless retirement planning to funding your children’s biggest dreams, turn your financial goals into reality. 🔥
Subscribe for money management solutions via email! (Link takes you to our email sign-up form) Join 32,000+ readers in our community.
👉 New Tool Alert! NaviPlan: A Privacy-Focused Multi-asset Tracker and Goal Planner 👈
As pointed out by Krishna and Jignesh, moneycontrol is better than Yahoo Finance in this regard. Which is a pity because it is easier to get it from the latter.
Price data from all BSE indices can be used for comparison. The standalone version of this module is here
Since the stock price is adjusted for company action, it is better if the index chosen for comparison is the total returns index and not the price index.
The sheet has instructions for interested users on how to work with total returns data.
The metrics used are identical to that used in the mutual fund analyzer tool:
Beta, standard deviation, alpha, Sharpe ratio, Treynor ratio, information ratio, omega ratio, Sortino ratio, upside and downside capture ratios and the Ulcer index
To get a brief idea about these metrics, users can consult: Mutual Fund Risk-return analyzer Mutual Fund analysis with the Ulcer Index Simplify Mutual Fund Analysis with Upside/Downside Capture Ratios Caution must be exercised while interpreting results. Invariably most mutual funds outperform their indices. The same is true for a good business but the margin of outperformance maybe much higher. So one could own such a business at greater risk. For mutual funds the inevitable debate/comparison is between active vs. passive(the index used for comparison).In the case of stocks, one looks for consistency of performance (with the ‘annual’ version) and the kind of long-term reward (and risk expected – with the ‘investment duration’ version). A stock outperforming the index means little here. Unfortunately, risk-reward calculations require an index.
A stock A vs. stock B risk-reward comparison tool will be published soon.
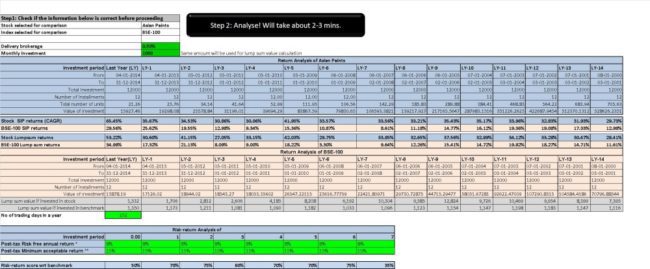
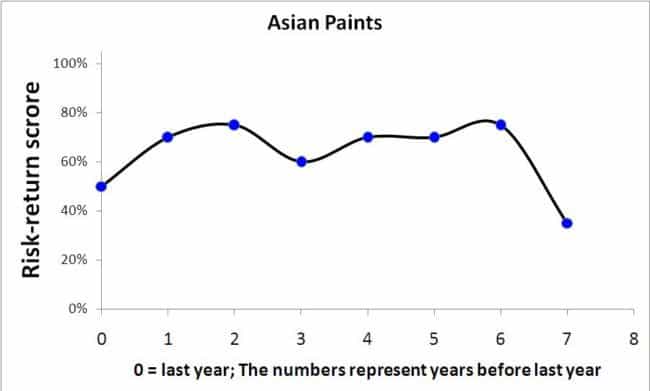
Here are some screenshots of the sheets and results obtained with Asian Paints and BSE 100 (the index it is part of). Asian paints is used foe representation purposes only. I do not hold stocks of this company.

Download the stock price analyser
Comments and suggestions are welcome