
Last Updated on January 10, 2023 at 10:05 pm
Sooner or later mutual fund investors recognize that there is more to a mutual fund than the return it generates.
Analysing a mutual fund when one wants to begin investing, or when one wants to evaluate current holdings, requires a comparison with the funds benchmark.
Some questions to ask and answer:
- How consistently has the fund beat its benchmark?
- What is the risk involved in producing returns?
There are several ways to answer both questions. For example, a rolling returns analysis can be used to understand how consistently a fund has performed with respect to its benchmark. Here is an automated rolling returns calculator to find out how this works.
🔥Secure your future with our Robo-advisory tool trusted by over 3,500 investors and advisors. From effortless retirement planning to funding your children’s biggest dreams, turn your financial goals into reality. 🔥
Subscribe for money management solutions via email! (Link takes you to our email sign-up form) Join 32,000+ readers in our community.
👉 New Tool Alert! NaviPlan: A Privacy-Focused Multi-asset Tracker and Goal Planner 👈
To evaluate risk-adjusted returns, one will have to get used to metrics like alpha, beta, Sharpe ratio, Sortino ratio, Treynor ratio etc. Here is a simple way to understand them and an analyzer based on them
Although these metrics and the idea of rolling returns is not very difficult, most investors are not comfortable with it.
Is there a much more simpler, but insightful measure that can be readily used by investors to evaluate mutual fund performance?
Thankfully yes: The Upside and Downside Capture Ratios
These ratios can help investor evaluate consistency of a mutual funds performance.
When the benchmark has given a positive return (> 0), has the fund outperformed it?
The Upside Capture ratio answer this question in the form of a percentage.
If you compare an index fund with its benchmark, the Upside Capture ratio is 100% (ideally). That is whenever the benchmark gave a positive return, so did the index fund. Perfectly understandable. That is the way it should be.
If a fund has a capture ratio greater than 100%, then it has beaten the benchmark during periods of positive returns.
If the capture ratio is say, 70%, then the fund has captured only 70% of the benchmarks positive performance.
Therefore, higher (> 100%) the upside capture ratio, the better.
Wait a minute. Not so fast.
What good are higher positive returns if the fund loses it all, and perhaps more during periods of negative benchmark returns?
Enter the Downside Capture Ratio – the mutual fund investor’s best friend!
The source of alpha for almost all active funds!
The Downside Capture ratio answers the following question in the form of a percentage:
When the benchmark recorded a loss, that is a negative return (< 0), did the fund record a lower or higher loss?
Obviously we would want the fund to record lower losses.
For an index fund, the downside capture ratio would ideally be 100%.
If a fund records a downside capture ratio of 65%, it means that it has captured only 65% of the benchmarks loss.
So lower the downside ratio (<100%), the better.
I think this is by far the simplest yet insightful metric analysts have come up with.
I think most investors can understand this without too much effort.
Capture ratio
Upside ratio/Downside ratio = Capture ratio
Higher the capture ratio, higher the chances the fund outperforms the benchmark.
Where can I find it?
Morning Star India offers Upside and Downside Capture ratios in the risk & rating tab of its fund page.
Let us look at some examples:
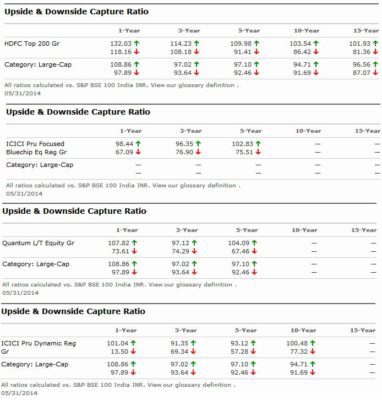
Notice that excellent Downside Capture ratio is common to all the funds we consider(ed!) as ‘good’.
Hence while choosing a mutual fund one can shortlist a few funds based on this guide and check their downside and upside capture ratios and choose funds with consistently low downside capture ratios.
In my opinion this is enough to comfortably beat the index.
Unfortunately, irrespective of the fund, the morningstar ratios are always calculated wrt BSE 100.
To resolve this, I have now incorporated these ratios in the Mutual Fund Risk and Return Analyzer Sheet
The formula used is different from the one used by Morningstar but the meaning it conveys is the same.
You can calculate these ratios against 31 indices for 1-8 year durations.
The capture ratio of the fund and index is defined as
Capture ratio = Upside capture/Downside capture
Here upside capture and downside capture refers to the average (CAGR)of the returns during positive and negative periods of the index.
If the fund has outperformed the index, The fund capture ratio will be greater than the index capture ratio.
Here are the upside downside graphs from risk/return analysis tool
What do you think? Do you agree with me that these ratios are much simpler to understand than other metrics?
This tool is now part of the freefincal investor circle. Join the investor circle! Enjoy a 50% discount for a limited time and pay only Rs. 3000 with discount code circle50. You can get lifetime access to several unique tools, discussion forums, and bug fixes.