Last Updated on August 8, 2026 at 10:53 pm
Mutual fund investments are subject to market risk! Haven’t we heard that one before?!
If we wish to analyze the performance of a mutual fund, we should know how to evaluate returns and how to evaluate volatility.
Volatility, not risk. Risk pertains to your financial goal. Volatility pertains to the instrument.
There are many ways to evaluate volatility and return. Here is a list of mutual fund volatility measures:
🔥Secure your future with our Robo-advisory tool trusted by over 3,500 investors and advisors. From effortless retirement planning to funding your children’s biggest dreams, turn your financial goals into reality. 🔥
Subscribe for money management solutions via email! (Link takes you to our email sign-up form) Join 32,000+ readers in our community.
👉 New Tool Alert! NaviPlan: A Privacy-Focused Multi-asset Tracker and Goal Planner 👈
- Alpha
- Beta
- Standard deviation
- R-squared,
- Sharpe ratio
- Sortino ratio.
- Treynor ratio
I had used the first 5 measured in my Step-by-step guide to choosing a mutual fund
Like anything else in life, they have their share of advantages and disadvantages.
Question: Can we get a visual feel for what the mutual fund volatility measures represent without learning the math?
The following is an attempt to answer this question.
Caution: If a man is forced to stand very close to an elephant, his view will depend on where he stands. The results of these volatility measures are quite like that. So if we wish to take them seriously, we should be aware that results will change with duration and that these measures should be used collectively to evaluate fund performance.
Note: The following is a crude attempt written by a layman, for a layman. Purists and experts are unlikely to approve the following. If they have a better way of answering the above question, I will be delighted to hear from them.
In order to visualize volatility measures, we will compare the performance of Franklin India Blue Chip Fund (FIBCF) with BSE Sensex. Regular readers will be aware that FIBCF is a regular in the blog and has been featured in the following posts.
- Mutual Fund Rolling Returns Analysis: Franklin India Blue Chip Fund
- Daily vs. Monthly vs. Quarterly SIP
- Step-by-step Guide to Choosing a Mutual Fund
To compare the performance we will use rolling returns obtained with: mutual fund rolling returns calculator
Rolling returns help to evaluate the consistency of a fund performance with respect to its benchmark.
It is a return in which the start and end dates keep moving. For example, if I wish to find out the 1 year rolling returns, I do the following:
- Select a start date. Say, 1st Jan. 1997
- Calculate returns for both fund and benchmark from 1st Jan. 1997 to 31st Dec. 1997.
- Then calculate returns from 2nd Jan. 1997 to 1st Jan. 1998
- Repeat until we run out of data!
- The returns are then plotted with respect to the start date.
- This gives an idea of how often has delivered better returns than the benchmark.
1. Let us start with 15-year rolling returns of FIBCF and Sensex.

The average rolling return is represented by a horizontal line.
The gap between the two lines is a measure of outperformance and can be identified with alpha or Jensen’s alpha, named after Michael Jensen
Notice that the curve deviates from the average both ways (vertical arrows). That is, sometimes the return is more than the average and sometimes less.
The average of the deviations (both positive and negative) is the standard deviation
Standard deviation gives you a measure of how volatile a fund is.
Note: Although the standard deviation takes into account both positive and negative deviations, it is defined such that it is always positive.
2. Next, we look at 10-year rolling returns of FIBCF and Sensex.

Observe the vertical arrows. These represent times in the past when the Sensex has changed, that is moved up or down, rather suddenly. Notice how FIBCF responds to these changes. Typically, if the Sensex rises/falls, FIBCF rises/falls more.
If we average the difference in the rise/fall, we get an idea of how much more or less volatile FIBCF is with respect to the Sensex. This measure is called beta
3. Now, let us look at 1-year rolling returns of FIBCF and Sensex.
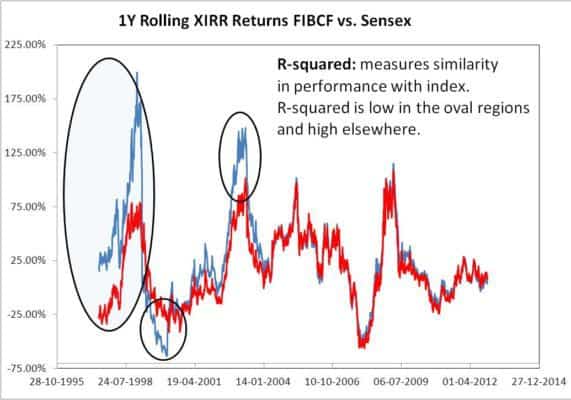
The 1Y rolling return paints a very different picture! The FIBCF(blue) curve almost overlaps with that of the Sensex except for a few regions represented by ovals.
The extent of overlap of both the curves gives us a measure of similarity in performance between FIBCF and Sensex. This measure is called R-squared.
It is clear that except for the regions marked by ovals, FIBCF has tracked the Sensex. In the oval regions FIBCF has outperformed the Sensex by a huge extent (except for small period in 1999). So if we had been invested in FIBCF during such periods, our returns would have quite spectacular.
Had we invested in FIBCF after 2004, our returns would have been decent, perhaps a bit above Sensex – nothing sensational.
If you are worried about your investment, you could check returns with this
4. Let us get back to the 15-year rolling returns of FIBCF and Sensex.
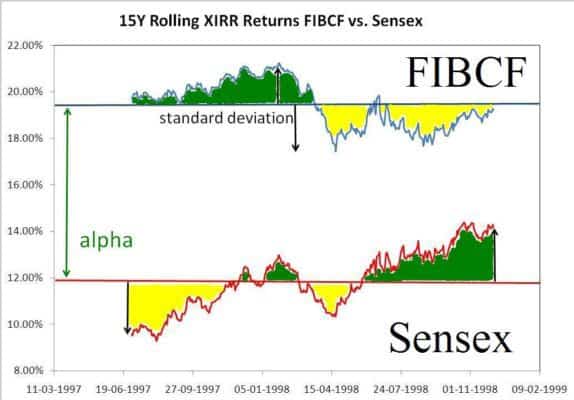
Notice that I have coloured the regions that have a higher return than the average (horizontal line) in green and regions with returns lower than the average in yellow.
Recall that the average of both deviations is the standard deviation.
Let us briefly digress and consider how post-tax return is computed. The relevance will become clear in a moment.
Suppose I have a FD which offers 10% each year. If I belong to the 30% tax slab, my post-tax interest rate is = 10% X (1-30.9%) = 6.91%. (30.9% is the effective tax rate including cess and surcharges). To summarise
Post-tax return = pre-tax return x (1-tax)
Now, let us define in a similar manner,
Post-risk return = Average return x (1-average deviation)
The post-risk return is calculated by taking into account the average deviation (standard deviation) from the mean return.
Such a measure is called the Sharpe ratio, named after William Sharpe.
The Sharpe ratio is a measure of ‘risk-adjusted performance’.
Note: Sharpe ratio is not defined like the post-risk return. I have introduced the notion of post-risk return to give us an idea of what it represents. Purists may kind
Now let us rewrite the expression for post-risk return in this way:
Post-risk return (Sharpe) = Average return x (1-average deviation [green and yellow regions] )
That is the post-risk return and the Sharpe ratio are calculated by taking into account the average of both positive deviations (green region) and negative deviations (yellow region) from the mean return.
Wait a minute. Positive deviations are going to give us more returns. So why should we include them in the average deviation and reduce the post-risk return?
Why not include only negative deviations (yellow region) in the average deviation?
Why not indeed! If we did that, we will be, according to Investopedia, “differentiating between good volatility and bad volatility” and we will get something that resembles the Sortino ratio, named after Dr. Frank Sortino
Post-risk return (Sortino) = Average return x (1-average deviation [yellow regions only] )
Note: Sortino ratio is not defined this way. I have used this as an illustration.
Limitations
- The fact that we use the concept of standard deviation implies that both positive and negative deviations occur with same probability (Normal distribution)
- So are we justified in picking and choosing deviations when both deviations are assumed to occur with equal probability? Debatable!
Standard deviation measured deviation with respect to the average. Instead, we could also measure deviation with respect to the benchmark. That is, how does the fund react to changes in the benchmark. As noted above this is called beta.
So why not write?
Post-risk return (Treynor) = Average return x (1- beta)
Why not indeed? We then get something that resembles the Treynor ratio
There is yet another volatility measure, the Fama and French three factor model. This takes into account, risk, return and nature of the underlying asset (market cap) to evaluate performance. I need to understand more about this. So I will leave this out of the present discussion.
Why should a retail investor bother about these volatility measures?
We pick a thorn with a thorn. If our investment is volatile, we need to know how to evaluate it. There is no other option, except seek professional help.
What should a retail investor look for?
We should look for a combination of high alpha, low beta, low standard deviation, high Sharpe, Sortino and Treynor ratios in all their mutual fund investments.
As for R-squared it should vary from high (large cap stocks) to low(multi-cap stocks) in the portfolio.
A worked illustration for using these parameters can be found here: Step-by-step guide to choosing a mutual fund
Decent resources on mutual fund volatility measures
- Beyond the Basics – Modern Portfolio Theory
- Performance Analysis
Most people (including one of the editors of MoneyLife magazine) dismiss these measures as ‘good for nothing’ mathematical gibberish.
I request people who dismiss time-tested and Nobel-prize winning concepts to show us alternative ways of evaluating volatile financial instruments.
Your take:
- What do you think?
- Were you able to get a feel for what these measures represent from this post?
- What do you to evaluate mutual fund performance?
- Can you think of better ways to represent these volatility measures?