Last Updated on September 4, 2018 at 10:19 am
Use this Excel tool to compare risk vs. reward in Indian stock investments. The index component of the stock price analyzer published yesterday has been removed to enable comparison between two stocks.
The way I see it, this comparison tool can be used for any stocks irrespective of the sector they belong (unlike financial statements). Such a comparison would help when there is not much to differentiate between two businesses based on the balance sheet history. Questions like, ‘which stock is more volatile?’, ‘which stock is less stressful to hold (Ulcer index analysis)?’ can be answered
Two versions of the sheet are available:
- The ‘annual’ version in which risk and reward metrics are computed for each annual year for the last 8 years and SIP and lump sum returns are calculated for the 15 years (if available of course).
- The ‘investment duration’ version calculates risk and reward metrics for investment durations ranging 1-8 years and SIP and lump sum returns are calculated for durations ranging 1-15 years.
The delivery brokerage is taken into account while calculating returns.
🔥Secure your future with our Robo-advisory tool trusted by over 3,500 investors and advisors. From effortless retirement planning to funding your children’s biggest dreams, turn your financial goals into reality. 🔥
Subscribe for money management solutions via email! (Link takes you to our email sign-up form) Join 32,000+ readers in our community.
👉 New Tool Alert! NaviPlan: A Privacy-Focused Multi-asset Tracker and Goal Planner 👈
The sheet pulls stock price data (adjusted for splits, dividends and bonuses) from Money Control. The earlier version of the historical stock downloader has now been updated with automatic retrieval of moneycontrol stock codes.
The metrics used are identical to that used in the mutual fund analyzer tool:
Beta, standard deviation, alpha, Sharpe ratio, Treynor ratio, information ratio, omega ratio, Sortino ratio, upside and downside capture ratios and the Ulcer index.
To get a brief idea about these metrics, users can consult: Mutual Fund Risk-return analyzer Mutual Fund analysis with the Ulcer Index Simplify Mutual Fund Analysis with Upside/Downside Capture RatiosMetrics like upside/downside ratios make better senses when stocks of the same industry are compared.
Here is a sample illustration. Note that I do not own both stocks.
Asian Paints vs. Berger Paints
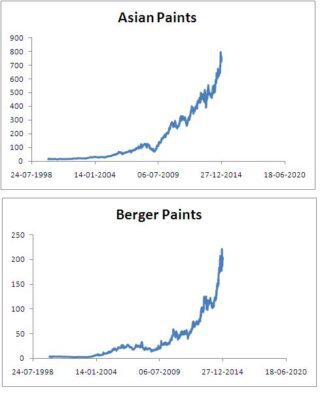
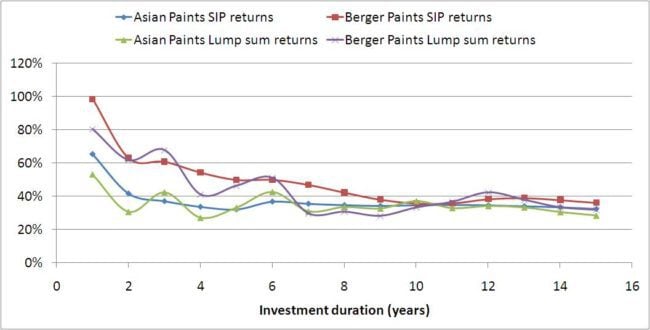
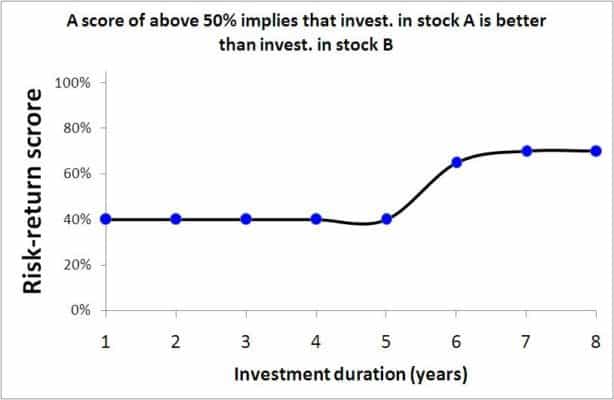
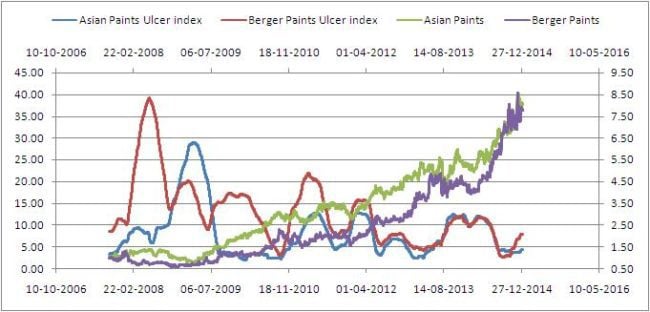
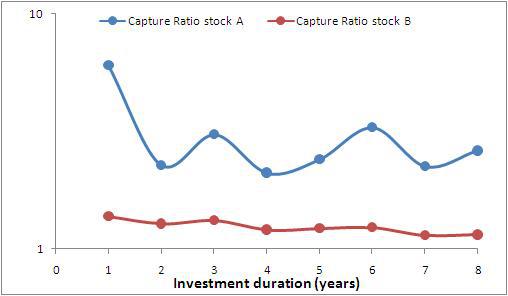
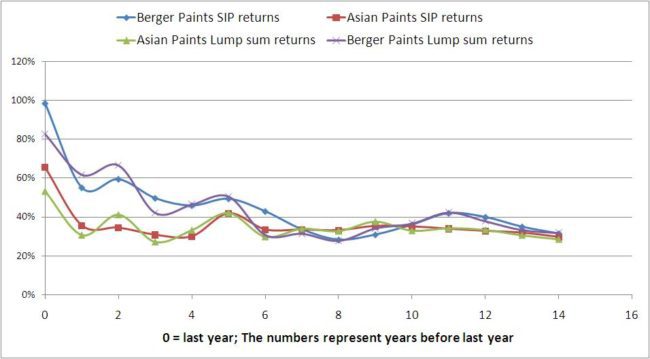
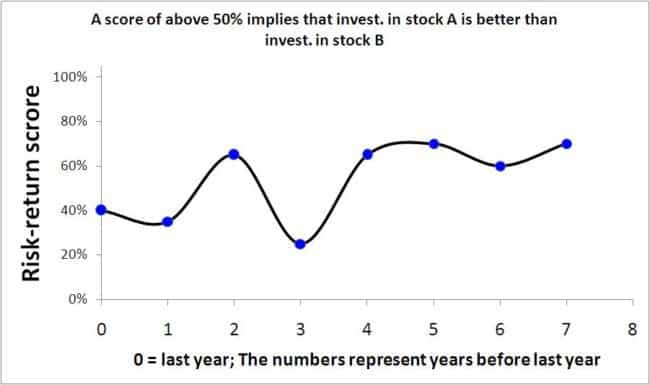
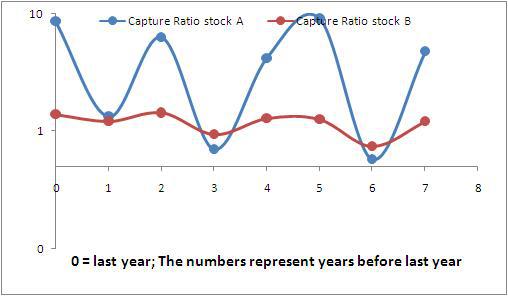
Based on these results, I think Berger paints is better than Asian paints. This is only one side of the coin. Now head over to the stock analyzer that uses morningstar balanced sheet data to find out consistency in financials and determine valuations.
Comments and suggestions are welcome.