Last Updated on December 28, 2021 at 6:46 pm
“I am worried about Quantum Long Term Equity Value Fund: Should I Exit?”, asked a reader. “Why does Value Research say this is a four star fund when it has only given half the benchmarks return in the past year?”, asked another. So that was enough encouragement for me to review the only fund from Quantum AMC. Wait, the only fund? Yes, check the assets of their funds and you will see what I mean.
Now my interest in this fund extends well beyond reader interest. Quantum Long Term Equity Value Fund (QLTE) is about 27% of my equity retirement corpus. For my other holdings see My personal financial audit 2017. QLTE is also part of my handpicked mutual funds list: PlumbLine. While I am personally satisfied with this without much analysis, I think a justification of why it is still part of PlumbLine is necessary.
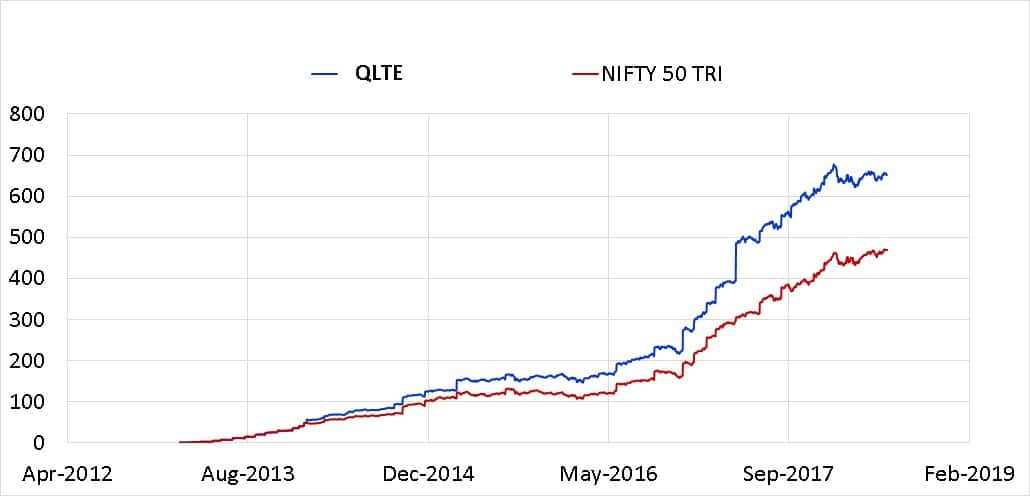
So this is my QLTE investments vs Nifty 50 TRI created with the Mutual Fund Portfolio Growth Visualizer With Index Benchmarking tool. Nothing to complain there!
🔥Secure your future with our Robo-advisory tool trusted by over 3,500 investors and advisors. From effortless retirement planning to funding your children’s biggest dreams, turn your financial goals into reality. 🔥
Subscribe for money management solutions via email! (Link takes you to our email sign-up form) Join 32,000+ readers in our community.
👉 New Tool Alert! NaviPlan: A Privacy-Focused Multi-asset Tracker and Goal Planner 👈
Quantum says my XIRR is 12.4% and this is correct. But it also says that the benchmark XIRR is 14%. So this means they are not calculating benchmark returns for the same dates and investments made in QLTE and this is wrong. Clearly, QLTE has outperformed the benchmark as far as I am concerned. Note: Sensex TRI is its benchmark, but we shall use NIfty 50 TRI which is practically identical.
There can no doubt that QLTE has underperformed the index over the last year, more than the last 2 years in fact and over the last 3 years, its outperformance has dropped to almost zero. How does one know this quickly without using stupid excel sheets from freefincal?
Simple, go to Value Research fund page, click on the performance tab, use the slider at the bottom of the graph and move it around. See my review of HDFC Equity based on this
If you want more insights, you can consider the Fingerprinting: A Visual Tool for Analyzing Mutual Fund Performance.

So you see the four coloured sections. Now move your eyes from the bottom-centre and move it up. The red dots that creep up are the dates. The black dots – the performance fingerprint. The red dot corresponds with the black dot vertically above or below.
As you move your eyes up, notice that in 2018, most of the black dots are in the underperformance section. So clearly the performance has dipped.
Don’t worry if you cannot figure out the above graph it will take a while to get used to. So the question is, should you worry? Yes if such a dip over such a duration has never occurred before and no if this is common (in my insignificant opinion of course).
Before you accuse me of posting graph after graph (which is true), let me give you a simple yes or no answer that many readers look for anyway. Let us use the rule that we discussed as part of Resolve -series: How to Quickly Decide: Should I stay invested or exit my mutual fund?
So let us consider 3-year returns (every possible 3Y return from 2006).
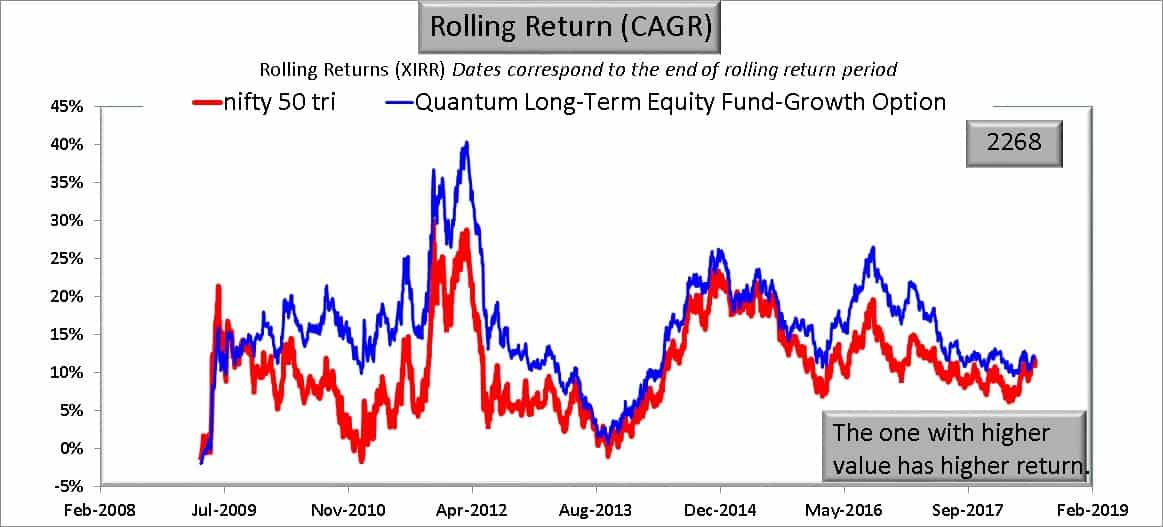
For pretty much every 3Y period considered, QLTE has beaten NIfty 50 TRI. So the verdict: stay put. Well, at least I am going to. Just like rolling return, one can also calculate rolling risk.
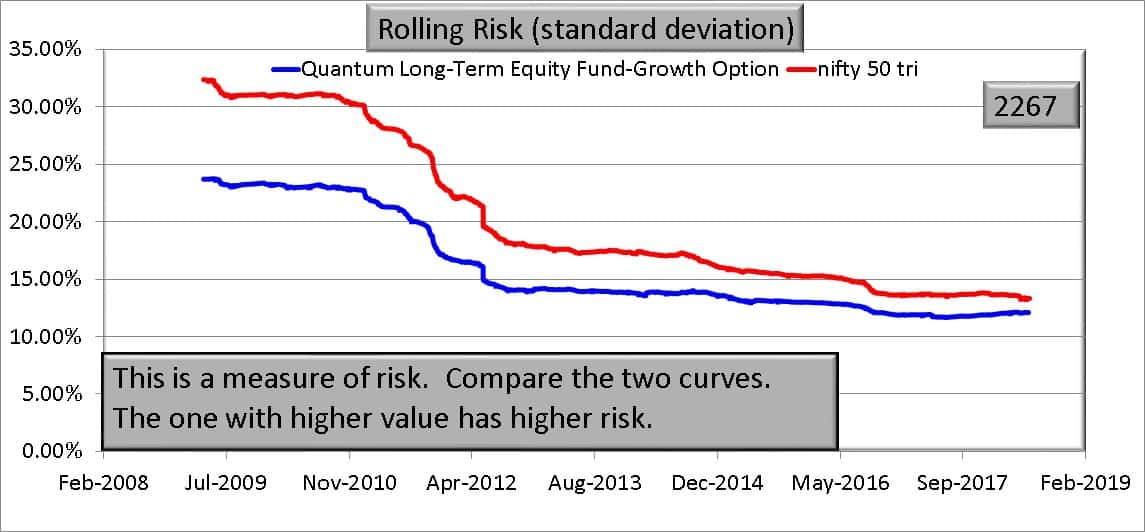
Notice that the quantum of risk outperformance (lower risk than the index) has dipped in recent times. Now if you were to look at the 1Y rolling return, the outperformance is only now and then.
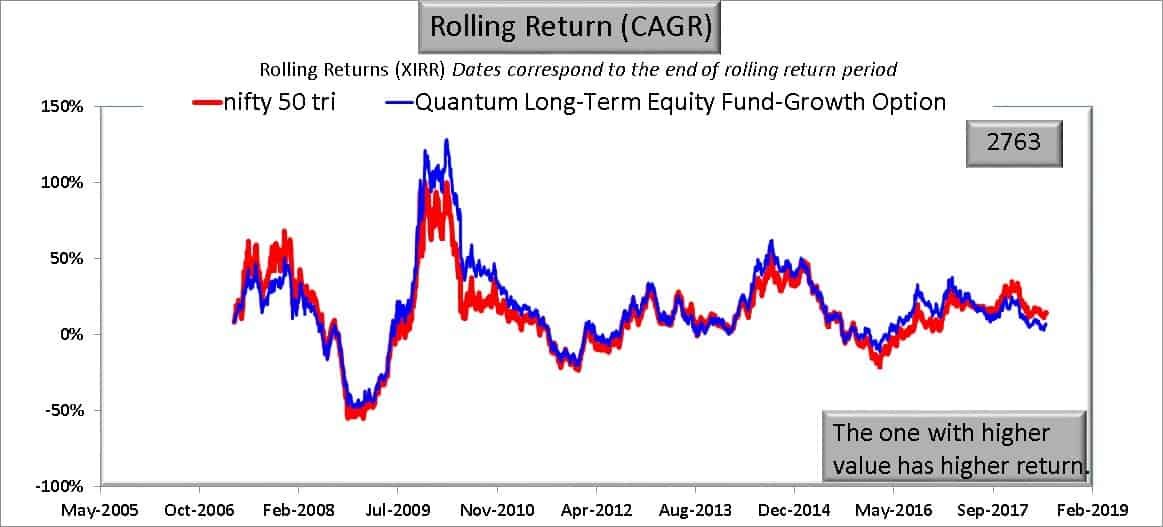
It is important to recognise that over 1Y this is how most funds will behave! Moral: you need to wait a bit long for consistent return outperformance. And as far as rolling risk over 1Y goes:
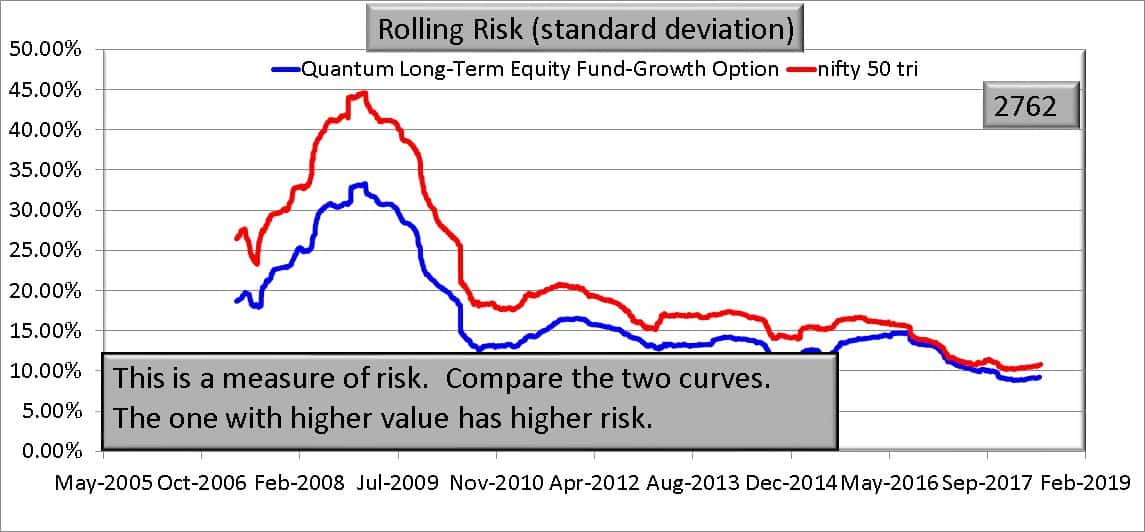
QLTE was fairly consistent in terms of risk outperformance until about 2Y ago. There is a small recovery in recent months, but I will keep an eye on this.
If you look at the 2Y rolling return periods, a periodic shift from outperformance to underperformance is seen.
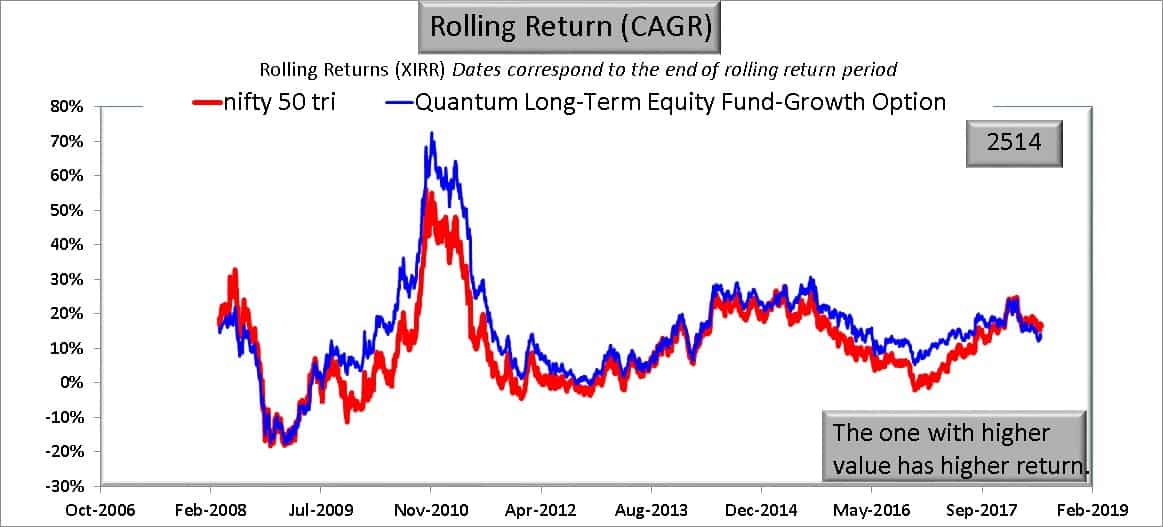
If you look at 5Y or 7Y (show below) periods, these smoothen out into outperformance.

So the fund has rewarded those who are patient.
The way QLTE works
To understand how QLTE works, and why I invest in it and recommend it, let us look at downside and upside capture ratios. I have written extensively on these and I would suggest that you look at: An introduction to Downside and Upside Capture Ratios and What is mutual fund downside protection and why is it important?
Downside capture = measure of how much the fund has lost whenever the index fell. So a downside capture of 70% means a fund has only captured 70% of the index losses. A downside capture of 110% means the fund has lost more than the benchmark. So lower the downside the better.
Upside capture = measure of much the fund has gained when the index has moved up. So higher the upside the better. An upside of 120% means the fund has captured 120% of the index gains or 20% more.
To understand QLTE, let us consider the 7-year rolling upside and downside capture ratios.
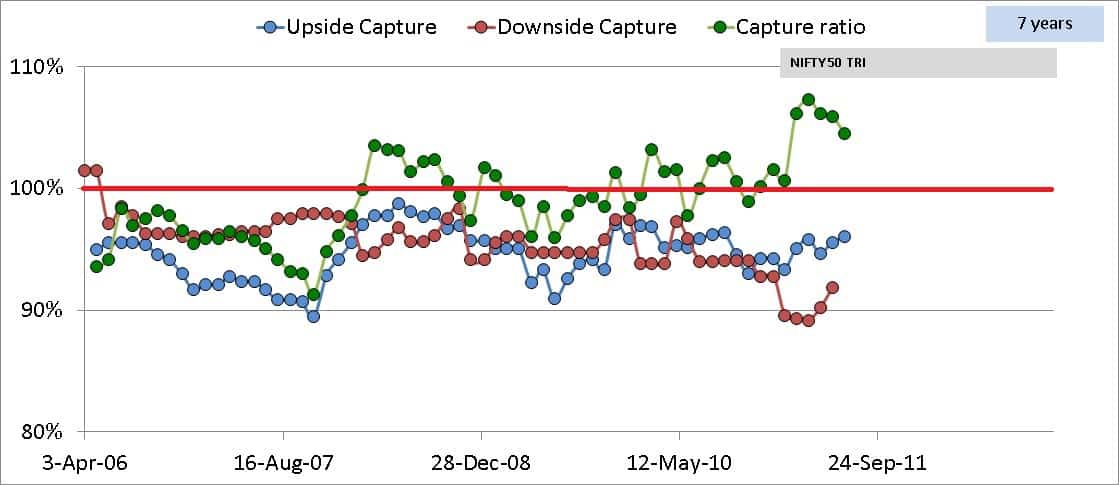
Notice that although the fund has consistently beat the index over 7Y periods (see above), its upside capture is always below 100%. This means the fund has never captured index returns when the index rose. However, its downside is also always below 100%. This means whenever the index fell, the fund always fell less. That is the primary reason why it outperforms the index over years. And that is why I invest in it and recommend it as part of PlumbLine. Well, looking at the funds AUM it is clear that many people do not like such a strategy. Well, who cares.
Now if you look over 1Y, notice the periodic spikes in downside capture.

Over shorter durations, the fund has lost more than the index from time to time. So this recent underperformance is not something new and I am not worried about it. The capture ratio is upside/downside. These graphs were created with the Equity Mutual Fund Rolling Upside/Downside Capture Calculator
So I am not going summarize as many people simply scroll down to read the summary and it is annoying. I do not back-seat drive a mutual fund. That is looking at monthly portfolios and debate what a fund manager is doing. I do not even know the name of QLTEs fund manager and I don’t care. However the way they pick stocks, it will be evident in the returns and risk. If those look good, I will stay put.