Last Updated on January 10, 2023 at 9:43 pm
In this post, I describe a visual tool for analysing mutual funds and portfolios, referred to as fingerprinting by its developer,Jim Otar, a Canada-based financial planner. I thank Swapnil Kendhe for bringing this method to my attention. As the song goes, ” I get by with a little help from my friends”.
I have developed an Excel sheet to replicate the idea and having tried a few funds, I feel that this would be a very good tool for analysing individual portfolios too. More on this later. For now, let us consider individual mutual funds.
Note: As a student of the subject, posts here represent my learning (and the lack thereof). This tool or any other tool here should be used with an understanding of the nature and limitations of the inputs and therefore the outputs.
How does fingerprinting work?
Suppose I have the NAV data of a fund and its benchmark.
🔥Secure your future with our Robo-advisory tool trusted by over 3,500 investors and advisors. From effortless retirement planning to funding your children’s biggest dreams, turn your financial goals into reality. 🔥
Subscribe for money management solutions via email! (Link takes you to our email sign-up form) Join 32,000+ readers in our community.
👉 New Tool Alert! NaviPlan: A Privacy-Focused Multi-asset Tracker and Goal Planner 👈
1 I calculate monthly return of both
2 Find out the difference between fund return and index return when the index return was positive. Call this up-market return.
3 Do the same when the index return was negative and call it down-market return
4 Take the six-month or one-year average of up and down market returns on rolling basis
5 Plot Up-market return (Y axis) vs Down market return (X axis) to create this kind of grid.
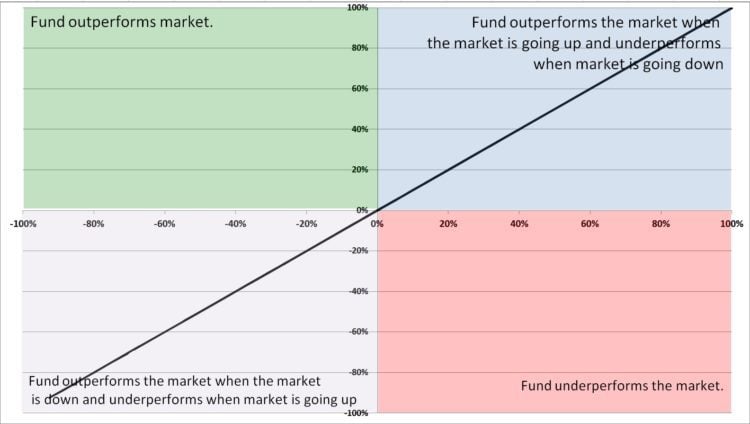
There are now four quadrants with four different fund performances. Obviously, we want funds that have data points in the top left quadrant and bottom left quadrant.
The diagonal line is a reference which separates ‘good’/acceptable data points in the top triangle and the borderline/’bad’ data points in the bottom triangle.
In what follows, I have only considered data for the last two years. Increasing the duration will make the plots messy.
Jim Otar’s presentation on fingerprinting which is the reference for this post can be found here.
Fingerprint of an ETF
An ETF is expected to track the index as closely as possible, provided there is enough liquidity. Therefore an ETF or Index fund should have data points very close to the centre – neither too much upside nor too much downside.
This is the fingerprint of Nifty Bees with respect to Nifty TRI.
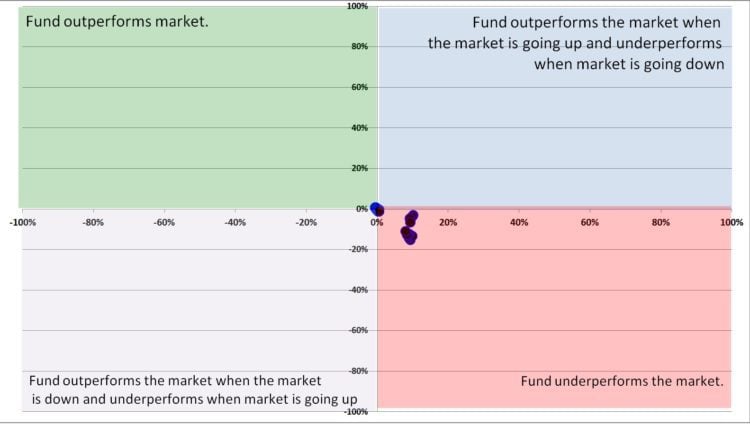
Notice the significant underperformance for a few months. This has to be due to the difference between price and NAV of the ETF. Reason: poor liquidity? In any case, the fingerprint reaffirms by belief to stay away from ETFs.
Fingerprint of an Index Fund
The above problem is not present for an index fund. This is for UTI Nifty index vs Nifty TRI.
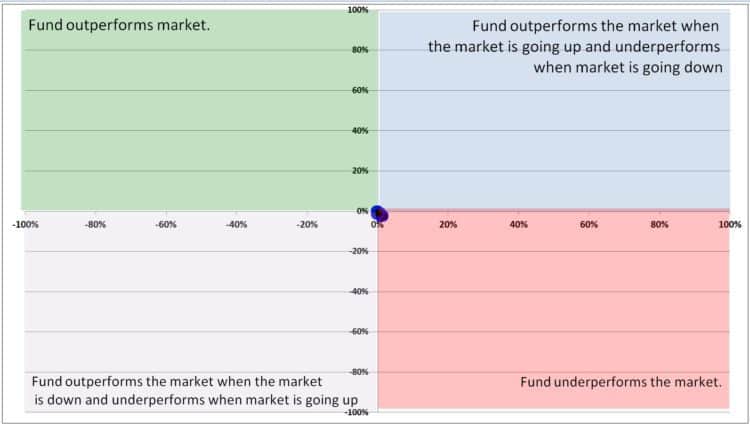
An index fund is so much simpler than an ETF!!
Fingerprint of Quantum Long Term Equity
Quantum Long Term Equity is a multi-cap fund benchmarked against Sensex TRI. However, it can pick stocks in the BSE 200 universe. So first let look at how it fares against BSE 200 TRI.
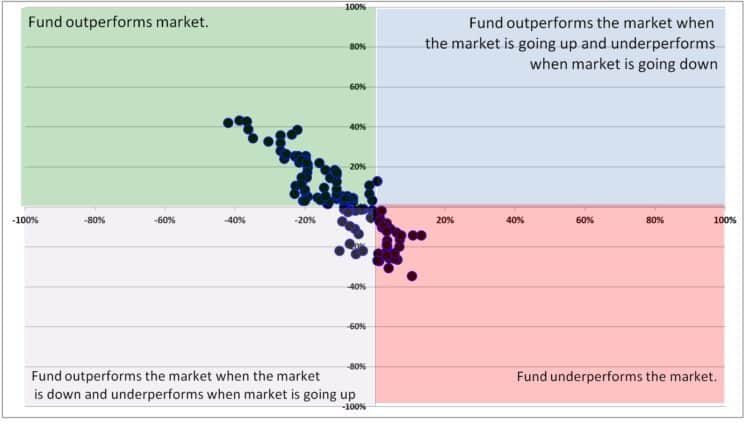
That is not bad at all. Brief months of underperformance is expected especially with a fund that holds cash. One can track the dates of such underperformance and correlate with monthly factsheets if interested (I am not).
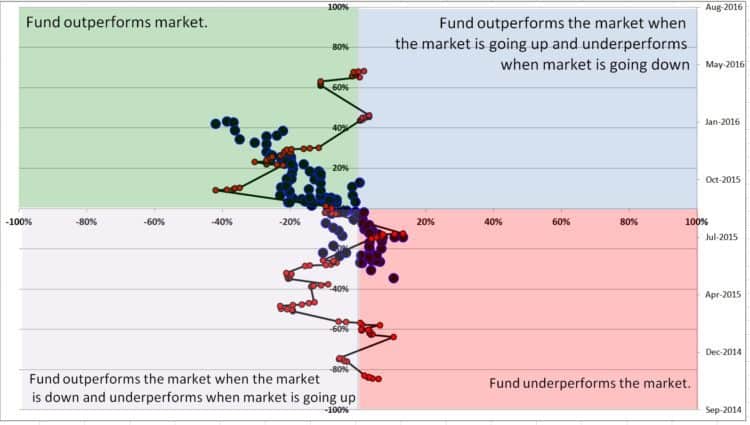
The date are now plotted in the right axis. The timeline increase from the bottom and zig-zags its way to the top. The Underperformance was between April to July 2015. During this period the fund also fell less than the market.
Then after Aug 2015, the fund significantly beat the index for a while. This can easily be correlated with Quantum’s cash position. Does it? Regular factsheet trackers please confirm.
Now let us see how the fund has fared against its specified benchmark: the Sensex TRI.
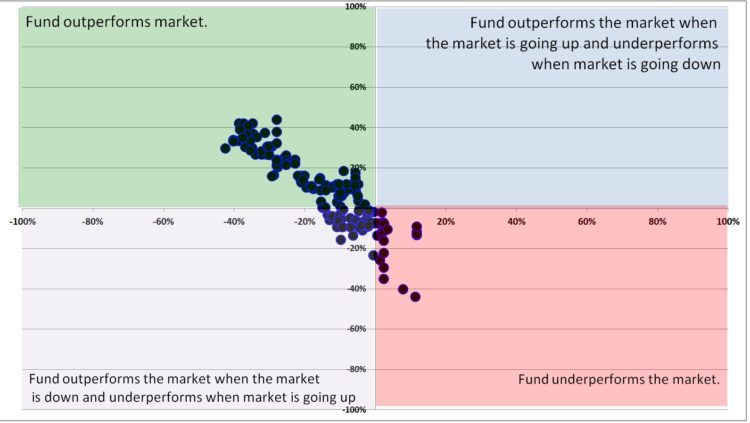
There is a small decrease in the underperformance.
Fingerprint of HDFC Top 200 (Direct Plan)
This is the fingerprint of HDFC Top 200 (direct plan) wrt BSE 200 TRI.
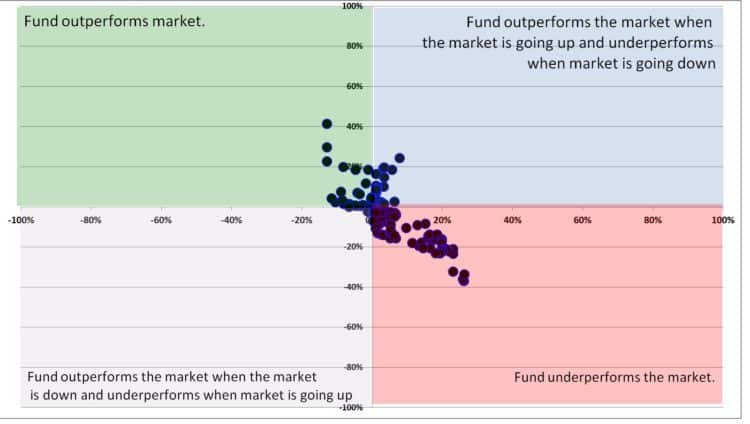
That is not a pretty picture at all! Even from Oct 1st 2006, the situation is not very different:
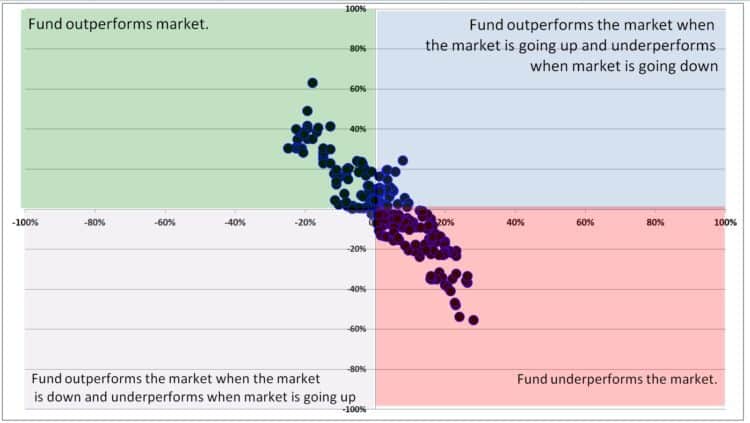
The problem with this fund has been: spectacular outperformance for a few months, followed by sustained underperformance. This does not mean the actual investor returns would be low. I am invested in this and my own returns have been more than okay. The fingerprint is primarily a tool to understand how a fund behaves. Whether it can use for investment decisions or not is debatable. Personally, I will not use this alone. I would prefer to use the cumulative outperformance feature in the Mutual Fund SIP XIRR Tracker.
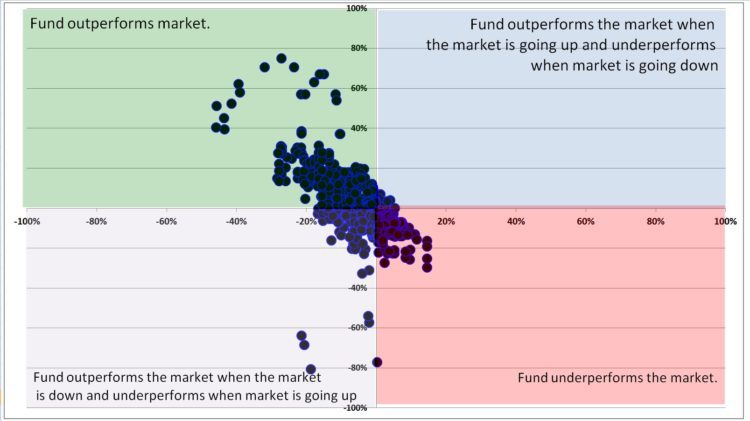
Fingerprint of ICICI Focussed Bluechip Equity
As an example of fantastic performance here is ICICI Bluechip vs Nifty TRI.
Fingerprint of DSP Microcap (Direct Plan)
Here is how DSP Microcap (the darling of investors with theoretically high-risk appetite?) fared against BSE Small CAP TRI.
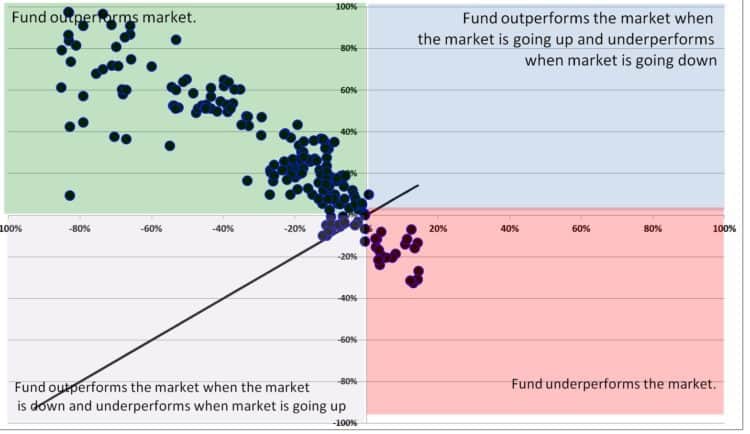
This data is for the last 3+Y since direct plans came into being and is pretty awesome!
How can this tool be used?
1. In my opinion, this can a good way to gauge investor stress visually. That is the stress associated with holding the fund. For another way of doing this visually, check the post on mutual Fund Analysis With the Ulcer Index.
2. Please do not base investment decisions only on this tool. As discussed yesterday, Good Personal Finance Questions with Arbitrary Answers!, how long a fund can underperform has an arbitrary answer.
3. Now imagine the above data with your portfolio (entire equity holdings) vs Sense or Nifty. Now that would be awesome! I am working on ways to autogenerate the graphs plotted here: Analysis: My Mutual Fund Investing Journey. Then such fingerprinting also will be possible. Fingers crossed.
4. Otar in his presentation (link above) refers to other uses, but I am not too comfortable about it.
This tool is now part of the freefincal investor circle. Join the investor circle! Enjoy a 50% discount for a limited time and pay only Rs. 3000 with discount code circle50. You can get lifetime access to several unique tools, discussion forums, and bug fixes.