Last Updated on December 29, 2021 at 11:55 am
Are we now in a bear market? Can we get an idea using long-term technical indicators? In my opinion, there are two robust ways to time the market for lowering investment risk: either use technical indicators/macroeconomic indicators or use a combination of both. Starting this month, I shall be publishing a market analysis based on both types of indicators to aid tactical asset allocation.
Why do you keep talking about timing the market? I am worried? Should I time the market? NO! You don’t need to time the market (click the link for proof). I am doing these posts as a student and there is no need for you to follow them. If you are not interested, please go these recent posts if you have not:
- Why Aggressive Hybrid (balanced) Mutual Funds score over diversified funds
- List of funds that have consistently beat benchmarks with good downside protection
In the mood to watch some videos? I just published the Tamil version of How to select a credit card for maximum benefit on Youtube (this is the 5th step in Tamil on basics of money management): க்ரெடிட் கார்டு தேர்வு செய்வது எப்படி (how to select a credit card) – பணமயமான எதிர்காலம் ஐந்தாம் படி
For October 2018, I shall stick to technical indicators alone and gradually build on this each month. Initially, I wanted to publish this each week, but perhaps that might be too much too often? I am only a student of technical analysis and a pretty sceptical student at that.
🔥Secure your future with our Robo-advisory tool trusted by over 3,500 investors and advisors. From effortless retirement planning to funding your children’s biggest dreams, turn your financial goals into reality. 🔥
Subscribe for money management solutions via email! (Link takes you to our email sign-up form) Join 32,000+ readers in our community.
👉 New Tool Alert! NaviPlan: A Privacy-Focused Multi-asset Tracker and Goal Planner 👈
The key reason I wish to do this periodically is to find out how hard it is to make investment decisions in real time. Since the technical indicators used are long-term in nature (eg. over 200 days and not 14 days as used by traders), the conclusions and interpretations will not be identical.
In any case, the essential point is to not treat the indicators as rules of nature and recognise that we are blind men touching an elephant and must not hesitate to change our stand (this becomes easier if we did not take a stand in the first place!).
Since we are going to touch an unknown object (= the market) blindfolded, it is important to send a team with different skillsets. That is use technical indicators that tell us different things and combine them. This will be the focus.
So without further ado, let us get on with it. If you are new to this, I suggest that you first start here: Spotting Market “highs” and “lows” Using Technical Indicators
Market Analysis October 2018: Moving Averages
200-day moving average
The simplest way to spot “trend” is to use a moving average. That is we take the last X days closing price and average it. The most common perhaps is the 200-day moving average as shown below
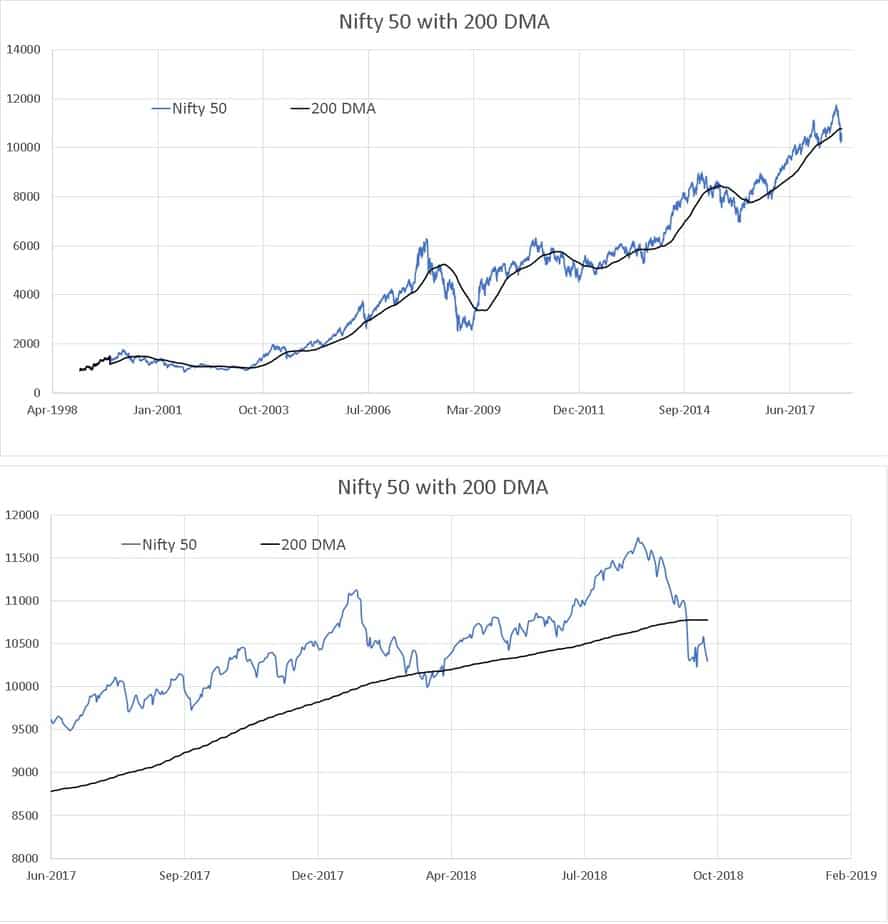
Down-trend: when the price is < 200dma. <== Current status.
While it is “okay” to buy more when the price is < 200 dma, it may be premature to exit or book profit when the price is > 200 dma. So we need better indicators.
Double moving average
Here we use a short and long-term moving average as explained earlier. This was also backtested before (with a more thorough analysis pending): Timing the market by spotting bullish and bearish trends.
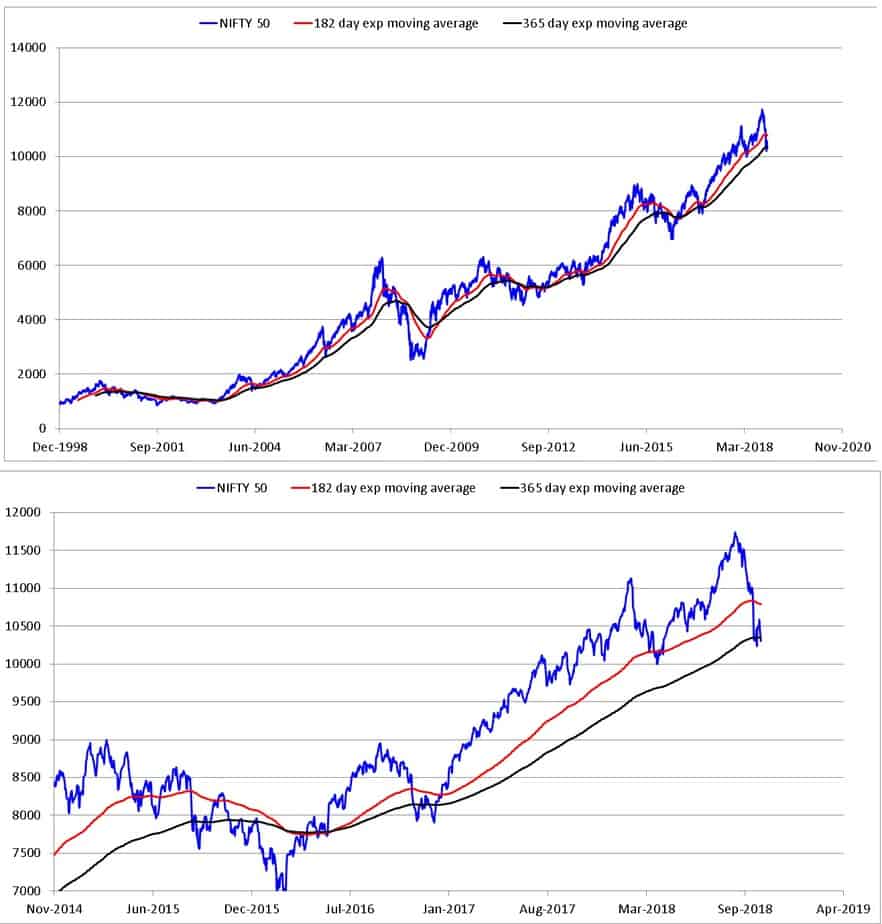
Up-trend: when the 180-day average move above the 365-day average from below.
Down-trend: When the 180-day average moves below the 365-day average from above.
Current status: Not (yet) a bear market.
Moving Average Convergence Divergence (MACD)
A potentially more sensitive method is to compute the difference between the two EMAs above and then take the moving average of the difference. The MACD seen below is the difference between the 180-day EMA and 365-day EMA. The average of this difference is known as the MACD signal or simply the signal. I have used a 136-day average.
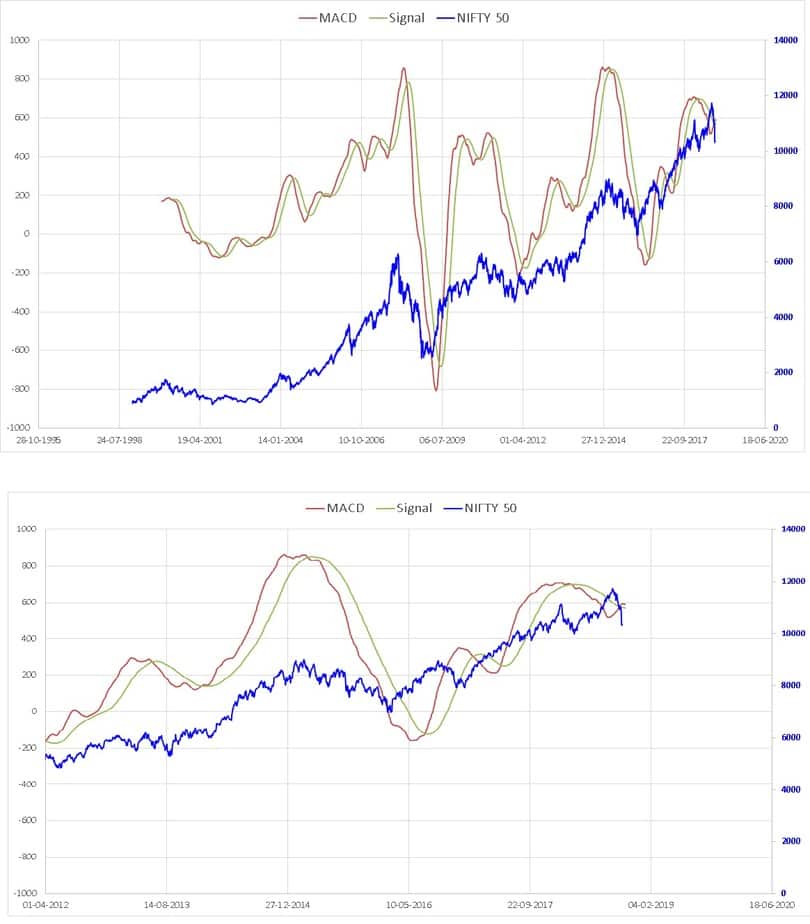
Down-trend: When the MACD goes below its signal.
Market Analysis October 2018: Bollinger Bands
This technique helps us make better decisions with the 200-day moving average and also gives us insights on market volatility.
Bollinger bands are essentially rolling standard deviation bands for the 200 dma. The upper band is usually set two standard deviations above the 200 dma and the lower band set at two below.
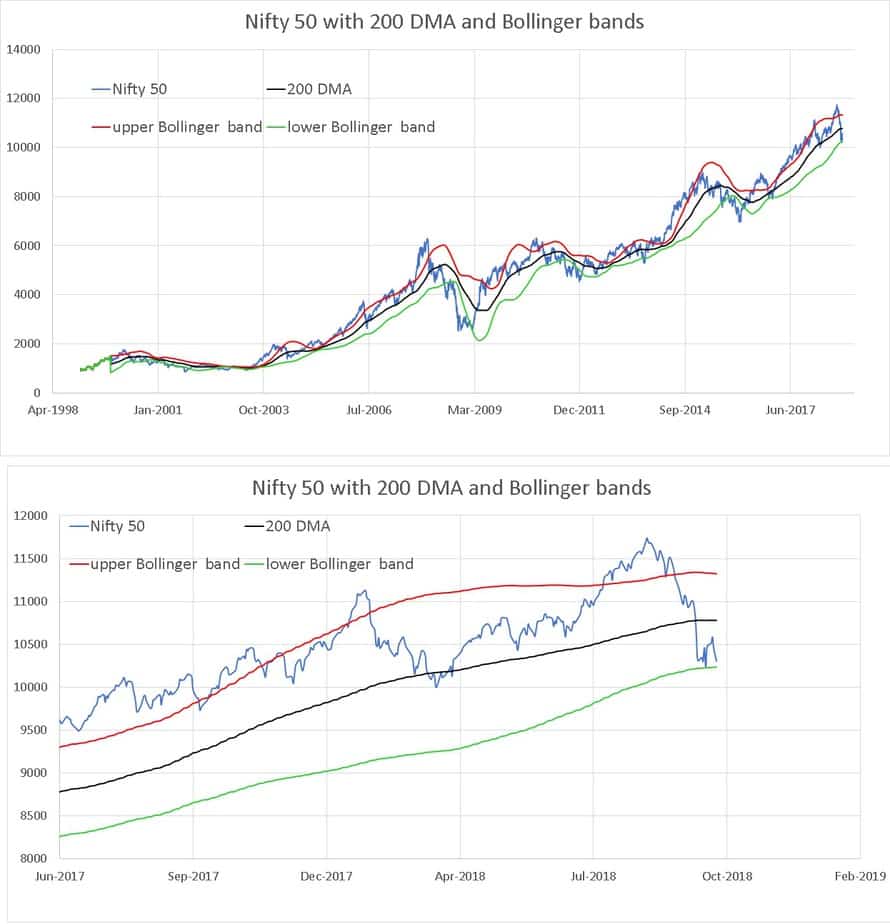
Buy/sell indication With the bands reasonably spaced apart, if the price hits the upper band, it could mean an overheated market and a sell indication. That is a bearish market outlook.
With the bands spaced reasonably apart, if the price hits the lower band, it could mean a buy indication.
Current status: The price is hovering about the lower band. So it is a good time to buy more (for long-term goals).
Relative strength indicator
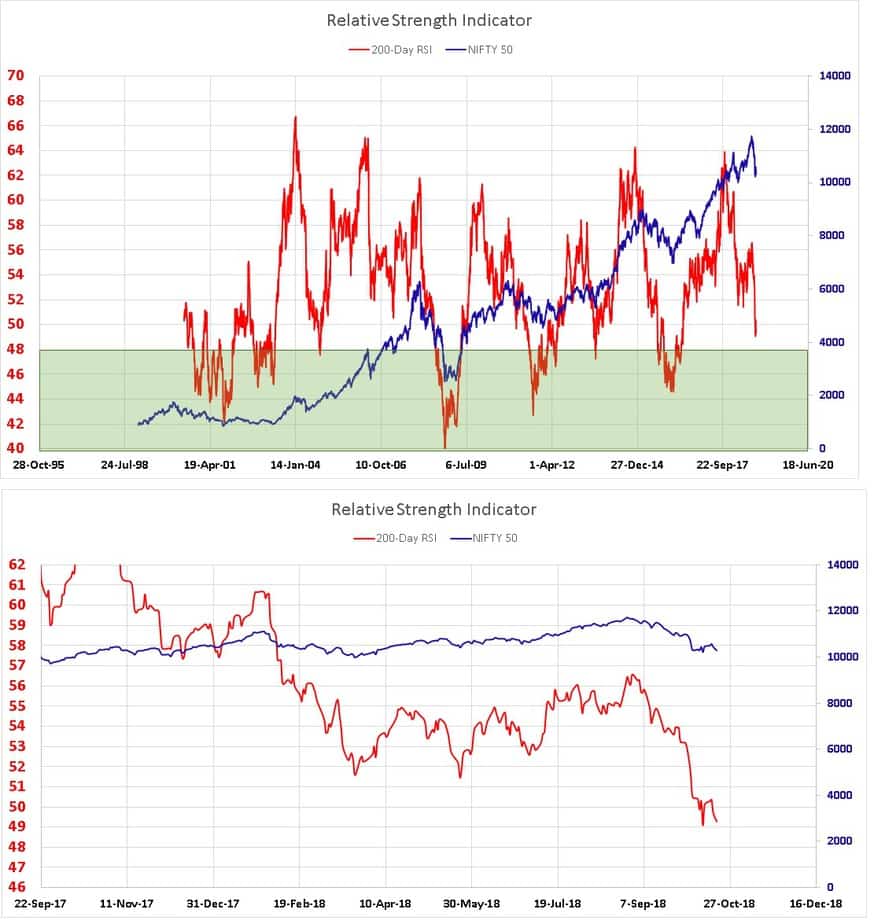
The simplest definition of the RSI is that it represents recent average gains divided by average losses. It is a market momentum indicator. If you look at the long-term (200 day here) RSI, a low RSI generally indicates a “buy signal”. People also look for divergences that is the difference in movement of price and RSI but I am not sure if this is possible with such a long-term average.
Nifty PE
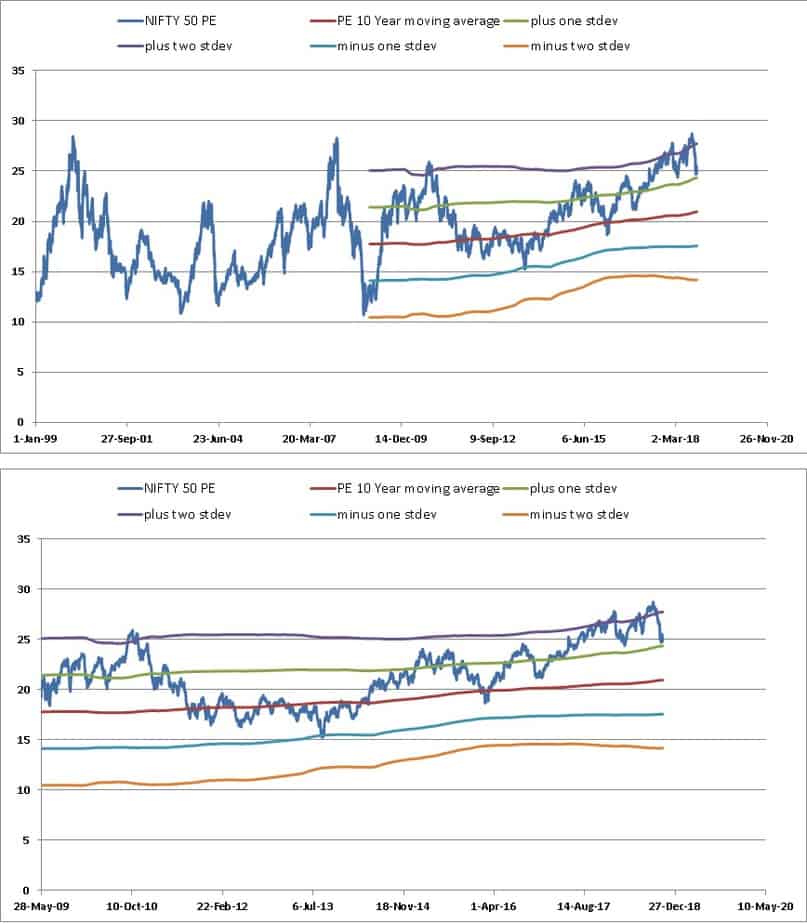
If we must take the Nifty PE levels seriously, it is currently one at one standard deviation above the 10-year rolling average. Can hardly call this a bear market.
Summary: Are we now in a bear market?
We have looked at four different type of indicators:
- Trend: 200 dma, double moving averages, MACD. Although the current Nifty level is below its 200dma, the 180 dma is still above the 365 dma. The MACD was however below its signal last few days but moved up closer. My opinion: Too soon to call this bearish.
- Volatility: Bollinger bands. The upper and lower bands are spaced apart. Although the price has hit the lower band, the trend (200 dma) is still not down. Again too soon to call this bearish.
- Momentum: RSI. The relative strength index fell sharply but is still some distance away from previous lows.
- Valuation. PE is still well above long-term average.
All in all, I think (and I still learning this) it is not yet a bearish market if we look at the price alone. If factor in rise in oil price, inflation and interest rates, the hope that kept the market up for the last few years seems to have quickly vanished. With an upcoming election and the BJP not guaranteed of a victory like last time, it would be reasonable to say that we are on the brink of a bearish trend (if not in one already). However, markets being markets can move anywhere.
How should I invest?
I have written about this in detail:
- Dear new investor this is the best time for you to invest in equity
- How should we invest in the present market condition?
As mentioned above, this is a fine time to invest. As long as your goals are far away, I suggest that you do not wait for a further fall and invest as much as possible.
I will try and add to this in the next edition. If you disagree with what is mentioned above, do point it out.
We are on Google News
Use this button to add freefincal.com as a preferred personal finance source on Google News.

Explore 1,400+ videos on YouTube!

Subscribe to get posts via email!
Join 32,000+ readers and get free money management solutions delivered to your inbox! (Link takes you to our email sign-up form)Join our WhatsApp Channel

Explore our products
🔥Join our community of 9000+ users! 🔥- Use our Robo-advisory Tool to create a complete financial plan! More than 3,500 investors and advisors use this! Use the discount code robo25 for 20% off. Plan your retirement (early, normal, before, and after), plus non-recurring financial goals (such as child education) and recurring financial goals (such as holidays and appliance purchases). The tool helps anyone aged 18 to 80 plan for retirement, plus six non-recurring and four recurring financial goals, with a detailed cash flow summary.
- Our Flagship Course! Learn to manage your portfolio like a pro to achieve your goals regardless of market conditions! More than 3,500 investors and advisors are part of our exclusive community! Get clarity on how to plan for your goals and achieve the necessary corpus no matter the market conditions! Watch the first lecture for free! One-time payment! No recurring fees! Lifelong access to videos! Reduce fear, uncertainty and doubt while investing! Learn how to plan for your goals before and after retirement with confidence.
- Join the freefincal investor circle! An exclusive space for investors, advisors, fintech employees and students to access financial planning and insurance tools, mutual fund and stock analysis tools, coding strategies and Excel macros for data extraction. 750+ members are now part of our investor circle.
- Increase your income by getting people to pay for your skills! More than 900 salaried employees, entrepreneurs and financial advisors are part of our exclusive community! Learn how to get people to pay for your skills! Whether you are a professional or small business owner seeking more clients through online visibility, or a salaried individual looking for side or passive income, we will show you how to do it by showcasing your skills and building a community that trusts and pays you. (Watch the 1st lecture for free). One-time payment! No recurring fees! Lifelong access to videos!
- Portfolio Tracker! Track your mutual funds and stock investments with our Google Sheet!
- We also publish monthly screeners for
Our Podcast: Let's Get Rich With Pattu
On Spotify: Let's Get RICH With PATTU! Every single Indian CAN grow their wealth! On Audible: Listen to the Let's Get Rich with Pattu Podcast

Listen to the Let's Get Rich With Pattu podcast on YouTube.
Now watch Let's Get Rich With Pattu தமிழில் (in Tamil)!About The Author

Dr M Pattabiraman giving a lecture
- Dr M. Pattabiraman (PhD) is the founder, managing editor and primary author of freefincal. He is an associate professor at the Indian Institute of Technology, Madras.
- He has over 14 years of experience publishing news analysis, research and financial product development. He has over 28 years of teaching and research experience. He is also a public speaker and keynote presenter.
- He is a patron and co-founder of “Fee-only India,” an organisation promoting unbiased, commission-free, AUM-independent investment advice.
- Connect with him via @pattufreefincal on X LinkedIn YouTube
- Pattabiraman has co-authored three print books.

This book helps you ask the right questions and find the right answers. It also includes nine online calculators to create custom solutions.
(2) Gamechanger: Forget Startups, Join Corporate & Still Live the Rich Life You Want. 

Both the boy and girl versions of "Chinchu Gets a Superpower".
Most investor problems stem from a lack of poor decision-making. We made bad decisions and money mistakes when we started earning, and we spent years undoing them. Why should our children go through the same pain? What is this book about? As parents, what if we had to groom one ability in our children that matters not only for money management and investing but for every aspect of life? My answer: Sound decision-making. So, in this book, we meet Chinchu, who is about to turn 10. The story follows what he wants for his birthday and how his parents plan it, while also teaching him key ideas about decision-making and money management. What readers say! 
Feedback from a young reader after reading Chinchu Gets a Superpower!
Must-read book even for adults! This is something that every parent should teach their kids right from a young age. The importance of money management and decision-making based on their wants and needs. Very nicely written in simple terms. - Arun.
About freefincal & its content policy
Freefincal is a News Media organisation dedicated to providing original analysis, reports, reviews and insights on mutual funds, stocks, investing, retirement and personal finance developments. We do so without conflict of interest and bias. Follow us on Google News. Freefincal serves more than three million readers a year (5 million page views) with articles based only on factual information and detailed analysis by its authors. All statements made will be verified with credible and knowledgeable sources before publication. Freefincal does not publish paid articles, promotions, PR, satire or opinions without data. All opinions will be inferences backed by verifiable, reproducible evidence/data. Contact Information: To get in touch, please use our contact form. (Sponsored posts or paid collaborations will not be entertained.)Our publications
- Your Ultimate Guide to Travel. This is an in-depth exploration of vacation planning, including how to find affordable flights, budget accommodations, and practical travel tips. It also examines the benefits of travelling slowly, both financially and psychologically, with links to relevant web pages and guidance at every step. Get the PDF for Rs 300 (instant download)

- How to profit from content writing: Our ebook is for those interested in getting a side income via content writing. It is available at a 50% discount for Rs. 500 only!