Last Updated on February 12, 2022 at 6:20 pm
For a while now, I have been wanting to do a full back-test of multiple market timing or tactical asset allocation strategies. I used a speaking invitation as an excuse to create a spreadsheet where multiple models can be quickly tested with 1000s of time periods. While at it, I asked myself, do we need to time the market? I also recognised that question is different from, can we time the market?
The answer to, “can we time the market?” is a vehement yes, but we should recognise that market timing strategies have one common goal – reduce risk. So yes, we can time the market to reduce risk in portfolios. This risk reduction may or may not be associated with return enhancement. It all depends on the method chosen, the associated costs and tax. Read more:
Want to time the market with Nifty PE? Learn from Franklin Dynamic PE Fund
Is it possible to time the market?
🔥Secure your future with our Robo-advisory tool trusted by over 3,000 investors and advisors. From effortless retirement planning to funding your children’s biggest dreams, turn your financial goals into reality. 🔥
Subscribe for money management solutions via email! (Link takes you to our email sign-up form) Join 32,000+ readers in our community.
👉 New Tool Alert! NaviPlan: A Privacy-Focused Multi-asset Tracker and Goal Planner 👈
Axis Dynamic Equity Fund: Investment Strategy Analysis
Deconstructing the Motilal Oswal Value Index (MOVI)
Dynamic Asset Allocation Mutual Funds: Yield Gap vs. P/E Ratio
In addition to these, I have also analysed tactical “dip” buying.
Nifty 200 DMA: Buying High vs Buying Low
Equity: Buying “High” vs Buying “Low”
Buying “low” vs Buying “systematically”: Surprise, Surprise!
Buying “low” with “active” cash vs buying systematically: still a surprise!
I am now building up to a series of tactical asset allocation back-tests with equity allocation swinging from 100% to 0%. And the results are pretty interesting. I am still thinking about how to present these results as they meant for the eyes of discerning DIY investors and can confuse newbie investors.
So I would like to first answer in this post: Do we need to time the market? Will I miss anything if I choose to avoid timing? The answer is: No, we do not need to time the market. No, we will not miss anything, BUT we need a proper strategy to systematically reduce risk in our portfolio.
This systematic risk reduction need not depend on any market signals. All we need is a clear goal. A clear date when we need the money and a clear target corpus. I had discussed this strategy in this post. Please read this in full as it will help you understand the context: How to reduce risk in an investment portfolio
Resolve is a series of steps on investing and portfolio management. In the first step, we considered how to quickly select equity mutual funds and build a diversified (equity) portfolio. As a second step, we discussed how to quickly decide if I should stay invested in a mutual fund or exit it. Now, in the third step, we consider goal based risk management.
Let us consider a goal that is 15 years away. The current cost of that goal is 10 lakh. Assuming 10% yearly inflation, the future cost is shown below (blue dots). If we start investing for this in a mix of equity and debt (fixed income), the corpus assuming same returns (10% from equity and 7% from debt – both post-tax), the total corpus will be shown as below. The investment is assumed to increase by 5% each year.

Naturally, the aim should be for corpus (red line) to hit the target (blue line) on or before the end of the 15Y period. We start from 0, so it ends at 14. When the returns are fixed, you get a nice smooth corpus growth. Returns in real life fluctuate wildly as you will see below. This is known as sequence of returns.
Now, there are two way to invest in equity and debt. Use the same asset allocation for each year. Say 60% equity and 40% debt. We will refer to this as constant equity allocation

Or we can reduce equity gradually as we approach the goal. I prefer a step-wise decrease (on paper at least) and this is the approach recommended in the Freefincal Robo Advisory Software Template. We will refer to this as the reducing equity allocation.

To these asset allocation strategies, we need real market returns. So I have used past Sensex annual returns.
To do this we take Sensex closing price. For the preliminary results shown here, I have used data from Jan 1991 to Jan 2018. This is the first return sequence considered
| From Date | To Date | Return |
| 01-07-1991 | 15 July 1992 | 121% |
| 15-07-1992 | 15 July 1993 | -26% |
| 19-07-1993 | 19 July 1994 | 96% |
| 21-07-1994 | 21 July 1995 | -16% |
| 25-07-1995 | 24 July 1996 | 1% |
| 26-07-1996 | 28 July 1997 | 17% |
| 30-07-1997 | 30 July 1998 | -24% |
| 03-08-1998 | 03 August 1999 | 45% |
| 05-08-1999 | 04 August 2000 | -9% |
| 08-08-2000 | 08 August 2001 | -24% |
| 10-08-2001 | 12 August 2002 | -9% |
| 14-08-2002 | 14 August 2003 | 30% |
| 19-08-2003 | 18 August 2004 | 26% |
| 20-08-2004 | 22 August 2005 | 53% |
| 24-08-2005 | 24 August 2006 | 51% |
So we use: 121%, -26%, 96%, -16%, 1%, 17%, -24%, 45%, -9%, -24%, -9%, 30%, 26%, 53%, 51% as the sequence of annual returns for our portfolio.
Then we change the first date in the above table (marked in red) to the next business day to create the next sequence and so on. Here is another example:
| From Date | To Date | Return |
| 07-08-1991 | 06-08-1992 | 53% |
| 06-08-1992 | 06-08-1993 | -6% |
| 10-08-1993 | 10-08-1994 | 83% |
| 16-08-1994 | 16-08-1995 | -24% |
| 21-08-1995 | 20-08-1996 | -4% |
| 23-08-1996 | 26-08-1997 | 20% |
| 27-08-1997 | 27-08-1998 | -27% |
| 31-08-1998 | 31-08-1999 | 67% |
| 02-09-1999 | 04-09-2000 | -3% |
| 05-09-2000 | 05-09-2001 | -30% |
| 07-09-2001 | 09-09-2002 | -3% |
| 11-09-2002 | 11-09-2003 | 41% |
| 15-09-2003 | 14-09-2004 | 29% |
| 16-09-2004 | 16-09-2005 | 53% |
| 20-09-2005 | 20-09-2006 | 42% |
So we keep repeating this to create return sequences and this is the last sequence considered.
| From Date | To Date | Return |
| 22-11-2002 | 24-11-2003 | 53% |
| 24-11-2003 | 23-11-2004 | 25% |
| 29-11-2004 | 29-11-2005 | 45% |
| 01-12-2005 | 01-12-2006 | 55% |
| 05-12-2006 | 05-12-2007 | 42% |
| 07-12-2007 | 08-12-2008 | -54% |
| 10-12-2008 | 10-12-2009 | 78% |
| 14-12-2009 | 14-12-2010 | 16% |
| 16-12-2010 | 16-12-2011 | -22% |
| 21-12-2011 | 20-12-2012 | 24% |
| 24-12-2012 | 24-12-2013 | 9% |
| 27-12-2013 | 29-12-2014 | 29% |
| 31-12-2014 | 31-12-2015 | -5% |
| 04-01-2016 | 03-01-2017 | 4% |
| 05-01-2017 | 05-01-2018 | 27% |
This gives us a total of 2670 return sequences to test. In the above linked post, I had presented a few examples. For: -18%, -12%, 27%, -27%, 52%, -13%, -22%, -3%, 69%, 23%, 43%, 54%, 35%, -55%, 86%. Each of these is a return after one of year of investing. So 15 annual returns for 15 years of investing.
Constant Equity method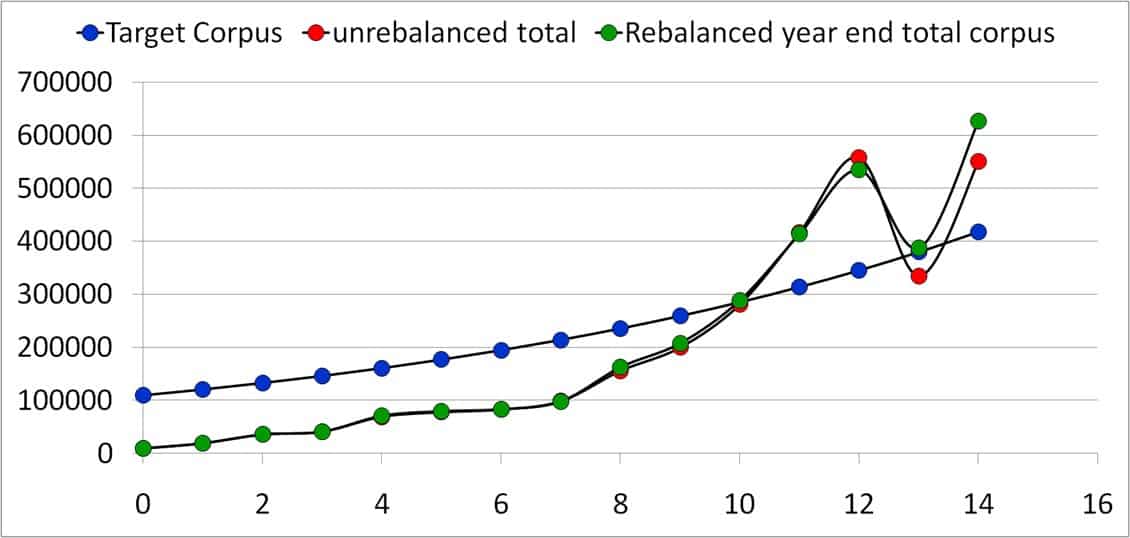
Decreasing Equity method
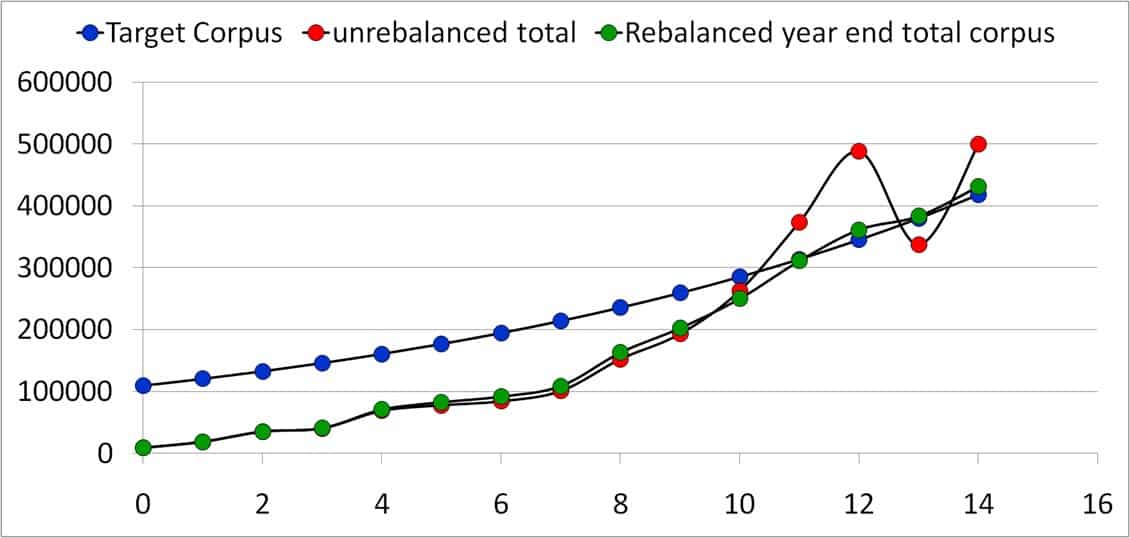
Now the question is, how do the results look if we backtest for all 2670 return sequences?
Constant Equity method (60% for all 15 years)
Total test runs: 2670
No of runs in which final portfolio value was equal to or above target value: 2670 (100%)
Decreasing Equity method (stepwise reduction)
Total test runs: 2670
No of runs in which final portfolio value was equal to or above target value: 2417 (91%)
No of runs in which final portfolio was equal to or above 90% of the target value: 2670 (100%). Full results will follow in a separate post.
Now, that is mighty impressive. Please note that the investment amount used for the decreasing equity method was the same as the constant equity method (the robo template accounts for this correctly). That is, it was lesser than necessary (when equity is fixed at 60% you need to invest less). So even then the result is remarkable.
So do you need to time the market? You can time the market if you wanted to, but there is no need. All you need to so is simple Goal Based Risk Managment to get you home.
UPDATE: Why we need to gradually pull out of equity investments well before we need the money!

Join 32,000+ readers and get free money management solutions delivered to your inbox! Subscribe to get posts via email! (Link takes you to our email sign-up form)
🔥You can also avail massive discounts on our courses and the freefincal investor circle! 🔥& join our community of 8000+ users!
Track your mutual funds and stock investments with this Google Sheet!
We also publish monthly equity mutual funds, debt and hybrid mutual funds, index funds, and ETF screeners, as well as momentum and low-volatility stock screeners.
You can follow our articles on Google News

We have over 1,000 videos on YouTube!

Join our WhatsApp Channel


- Do you have a comment about the above article? Reach out to us on Twitter: @freefincal or @pattufreefincal
- Have a question? Subscribe to our newsletter using the form below.
- Hit 'reply' to any email from us! We do not offer personalised investment advice. We can write a detailed article without mentioning your name if you have a generic question.
Join 32,000+ readers and get free money management solutions delivered to your inbox! Subscribe to get posts via email! (Link takes you to our email sign-up form)
About The Author
Dr M. Pattabiraman (PhD) is the founder, managing editor and primary author of freefincal. He is an associate professor at the Indian Institute of Technology, Madras. He has over 14 years of experience publishing news analysis, research and financial product development. Connect with him via Twitter(X), LinkedIn, or YouTube. Pattabiraman has co-authored three print books: (1) You can be rich too with goal-based investing (CNBC TV18) for DIY investors. (2) Gamechanger for young earners. (3) Chinchu Gets a Superpower! for kids. He has also written seven other free e-books on various money management topics. He is a patron and co-founder of “Fee-only India,” an organisation promoting unbiased, commission-free, AUM-independent investment advice.
Our flagship course! Learn to manage your portfolio like a pro to achieve your goals regardless of market conditions! ⇐ More than 3,500 investors and advisors are part of our exclusive community! Get clarity on how to plan for your goals and achieve the necessary corpus no matter the market condition!! Watch the first lecture for free! One-time payment! No recurring fees! Life-long access to videos! Reduce fear, uncertainty and doubt while investing! Learn how to plan for your goals before and after retirement with confidence.
Increase your income by getting people to pay for your skills! ⇐ More than 800 salaried employees, entrepreneurs and financial advisors are part of our exclusive community! Learn how to get people to pay for your skills! Whether you are a professional or small business owner seeking more clients through online visibility, or a salaried individual looking for a side income or passive income, we will show you how to achieve this by showcasing your skills and building a community that trusts and pays you. (watch 1st lecture for free). One-time payment! No recurring fees! Life-long access to videos!
Our book for kids: “Chinchu Gets a Superpower!” is now available!


Must-read book even for adults! This is something that every parent should teach their kids right from their young age. The importance of money management and decision making based on their wants and needs. Very nicely written in simple terms. - Arun.Buy the book: Chinchu gets a superpower for your child!
How to profit from content writing: Our new ebook is for those interested in getting a side income via content writing. It is available at a 50% discount for Rs. 500 only!
Do you want to check if the market is overvalued or undervalued? Use our market valuation tool (it will work with any index!), or get the Tactical Buy/Sell timing tool!
We publish monthly mutual fund screeners and momentum, low-volatility stock screeners.
About freefincal & its content policy. Freefincal is a News Media organisation dedicated to providing original analysis, reports, reviews and insights on mutual funds, stocks, investing, retirement and personal finance developments. We do so without conflict of interest and bias. Follow us on Google News. Freefincal serves more than three million readers a year (5 million page views) with articles based only on factual information and detailed analysis by its authors. All statements made will be verified with credible and knowledgeable sources before publication. Freefincal does not publish paid articles, promotions, PR, satire or opinions without data. All opinions will be inferences backed by verifiable, reproducible evidence/data. Contact Information: To get in touch, please use our contact form. (Sponsored posts or paid collaborations will not be entertained.)
Connect with us on social media
- Twitter @freefincal
- Subscribe to our YouTube Videos
- Posts feed via Feedburner.
Our publications
You Can Be Rich Too with Goal-Based Investing
 Published by CNBC TV18, this book is designed to help you ask the right questions and find the correct answers. Additionally, it comes with nine online calculators, allowing you to create custom solutions tailored to your lifestyle. Get it now.
Gamechanger: Forget Startups, Join Corporate & Still Live the Rich Life You Want
 This book is designed for young earners to get their basics right from the start! It will also help you travel to exotic places at a low cost! Get it or gift it to a young earner.
Your Ultimate Guide to Travel
 This is an in-depth exploration of vacation planning, including finding affordable flights, budget accommodations, and practical travel tips. It also examines the benefits of travelling slowly, both financially and psychologically, with links to relevant web pages and guidance at every step. Get the PDF for Rs 300 (instant download)