Last Updated on December 19, 2021 at 11:44 am
The corpus obtained when buying “low” or when the Nifty is below its 200 day moving average (dma) is compared with the corpus from buying “high” (nifty above 200 dma). Apologies for yet another post on this subject, but I had to satisfy my curiosity. Kindly bear with me.
Before we begin a clarification on nomenclature. As we all know, SIP is systematic investment plan. All thismeans, is investing with a system in place. Buying each month is just one of those systems. In the previous posts, I had used terms like low-SIP and high-SIP. This simply means, buying when the Nifty is below or above a certain average (10 month was used). The observation is made once a month and investing is done only the condition is satisfied.
In this post, I shall replace the 10-month moving average with the 200 day daily moving average. Observations are done daily. And as far as this post is concerned, there are three types:
Buying low or < 200 dma: Once Nifty crosses below (<) the 200 dma value, investing is done. And it is done on all days the Nifty is below the 200 dma. In an analysis like this I cannot pick and choose which “low” day to invest in. So it is better the risk is spread by investing on all low days. Buying high or > 200 dma: Once Nifty crosses above (>) the 200 dma value, investing is done. And it is done on all days the Nifty is above the 200 dma.
🔥Secure your future with our Robo-advisory tool trusted by over 3,000 investors and advisors. From effortless retirement planning to funding your children’s biggest dreams, turn your financial goals into reality. 🔥
Subscribe for money management solutions via email! (Link takes you to our email sign-up form) Join 32,000+ readers in our community.
👉 New Tool Alert! NaviPlan: A Privacy-Focused Multi-asset Tracker and Goal Planner 👈
Normal daily SIP: Investing is done daily. Not very practical, but I did it just for kicks. Not much will be made out of this. We will focus on the above two.
So I use the Nifty price index from Jan 1999 to Nov 2016. Those who understand what statistically significant means and value it, will agree that this is a short time period, especially for longer durations like 10Y and 15Y.
There are 3062 5Y periods between those two dates; 1819 10Y periods and 575 15Y periods. This is not a lot, but for it is worth, here it goes. If anyone is interested, I will be happy to repeat this study with the S&P500 index where daily data is available from about 1967 or so if memory serves me right.
As in the previous post, I shall assume that cash kept away for investing will earn 8% a year or about 0.021% a day. I assume that is earned only on business days. So when the time is ‘right’ or when the nifty is above or below the 200 DMA, the money put away + interest earned will be invested.
The total investment made in both buying high and buying low is either above (due to interest) or equal to a daily SIP.
FIVE YEARS
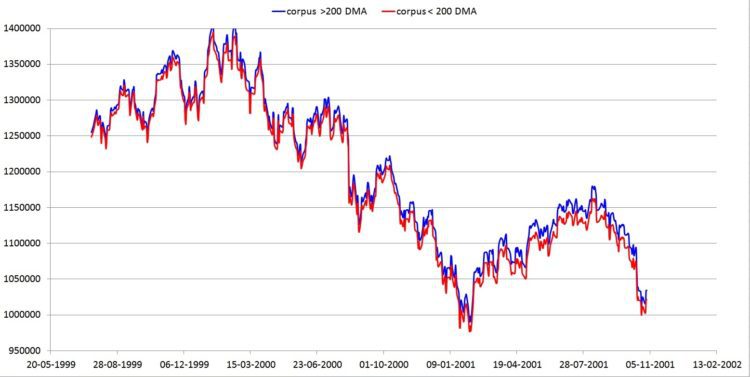
Buying “low” is compared with buying “high”. The corpus obtained over 5Y of buying low (< 200dma) and buying high (> 200 dma) is shown below.
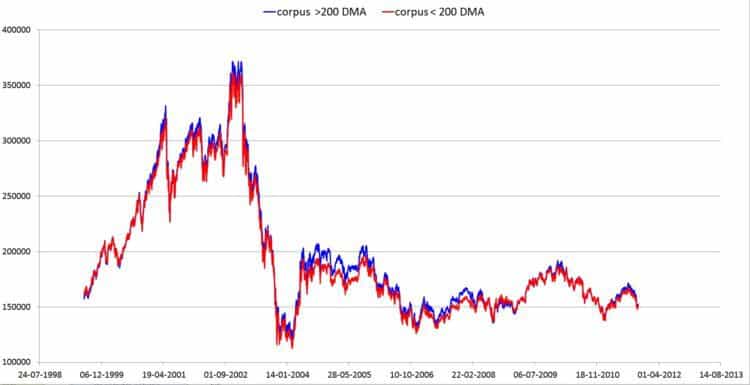
Notice that the buying high has generated a higher corpus for many periods. There are 3062 data points in each of the above curves and they represent a 5Y period.
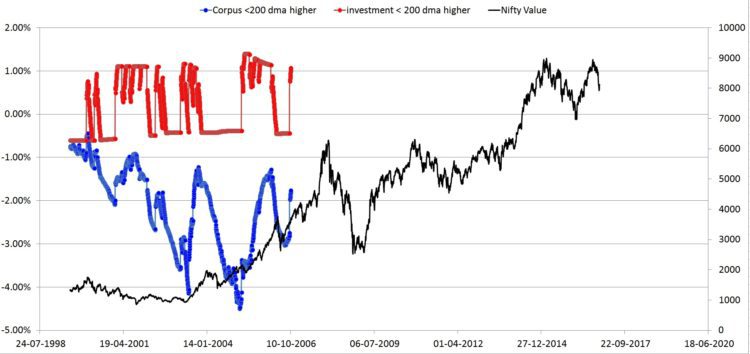
The excess corpus from buying “low” and excess investment from buying “low” is plotted below.
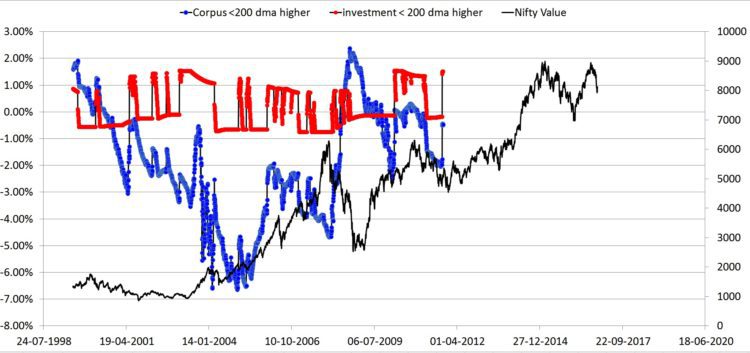
Notice that the excess corpus (blue) is negative. This means that there is no excess!! Buying low has resulted in a lower corpus for many periods except during the 2008 crash. Of course the difference is small. The point however is, buying low is not superior and buying high is not inferior! And by extension buying daily is okay too. And as established before there is not much difference between buying daily and buying month without reference to index value.
Sometimes buying low has a lower total investment than buying low and sometimes higher. Not by much though. Sometimes buying low results in a lower corpus for a higher investment!
I hope the manner in which I have plotted the comparison is clear. Apologies if it is not.
In a previous study on “does market timing work”, the key lesson was: Sometimes it does and sometimes it does not. There is no way of knowing this in real-time. Hindsight like this study is a different matter of course.
One can argue that buying low will win in the future. I have no issues with that. My goal is to convince myself (not you) that buying high is okay too and so is buying ‘whenever’. And I am convinced.
One can also argue that an investor can actively keep track of trends avoids losses and make only gains. I am not intelligent enough to respond to that. All I know is, if I am going to walk in the rain, I cannot hope to remain dry by walking between the raindrops. And I speak only for myself.
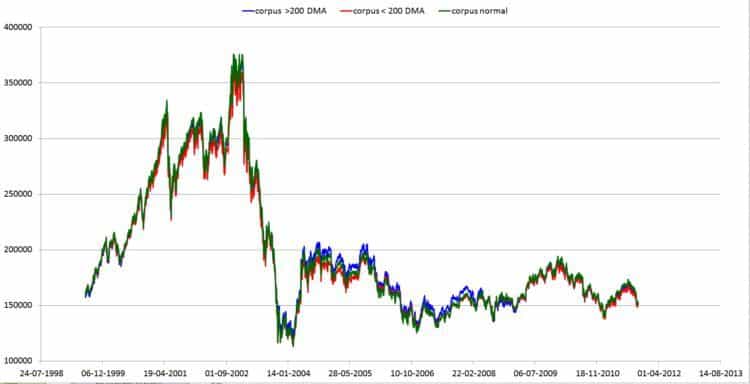
For the record, the daily SIP corpus is plotted with the other two below.
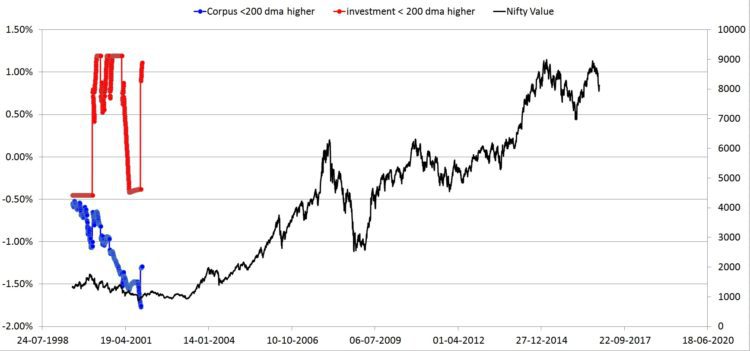
The pattern seen for 5 years is going to repeat over 10Y and 15Y, but with much lower data points as mentioned before. So I am going to present the graphs with no further commentary.
TEN YEARS
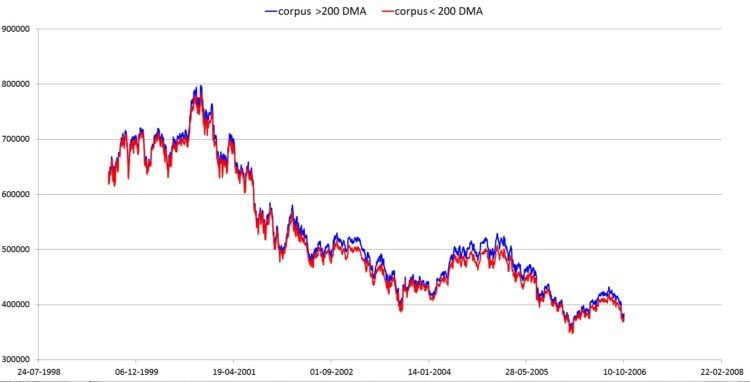
FIFTEEN YEARS
MDBSC*
My Dull and Boring SIPs Continue. The * stands for risk management with the intended financial goal in mind.
YOU can be Rich too with goal based investing
Our new book helps you answer the right questions on money management and invest with a clear purpose! Now available as hardcover and on Kindle.
Including 9 online calculator modules to create your own financial plan.
By PV Subramanyam and M. Pattabiraman.
Hardcover (₹ 375)
Kindle (244.30)

Join 32,000+ readers and get free money management solutions delivered to your inbox! Subscribe to get posts via email! (Link takes you to our email sign-up form)
🔥You can also avail massive discounts on our courses and the freefincal investor circle! 🔥& join our community of 8000+ users!
Track your mutual funds and stock investments with this Google Sheet!
We also publish monthly equity mutual funds, debt and hybrid mutual funds, index funds, and ETF screeners, as well as momentum and low-volatility stock screeners.
You can follow our articles on Google News

We have over 1,000 videos on YouTube!

Join our WhatsApp Channel


- Do you have a comment about the above article? Reach out to us on Twitter: @freefincal or @pattufreefincal
- Have a question? Subscribe to our newsletter using the form below.
- Hit 'reply' to any email from us! We do not offer personalised investment advice. We can write a detailed article without mentioning your name if you have a generic question.
Join 32,000+ readers and get free money management solutions delivered to your inbox! Subscribe to get posts via email! (Link takes you to our email sign-up form)
About The Author
Dr M. Pattabiraman (PhD) is the founder, managing editor and primary author of freefincal. He is an associate professor at the Indian Institute of Technology, Madras. He has over 14 years of experience publishing news analysis, research and financial product development. Connect with him via Twitter(X), LinkedIn, or YouTube. Pattabiraman has co-authored three print books: (1) You can be rich too with goal-based investing (CNBC TV18) for DIY investors. (2) Gamechanger for young earners. (3) Chinchu Gets a Superpower! for kids. He has also written seven other free e-books on various money management topics. He is a patron and co-founder of “Fee-only India,” an organisation promoting unbiased, commission-free, AUM-independent investment advice.
Our flagship course! Learn to manage your portfolio like a pro to achieve your goals regardless of market conditions! ⇐ More than 3,500 investors and advisors are part of our exclusive community! Get clarity on how to plan for your goals and achieve the necessary corpus no matter the market condition!! Watch the first lecture for free! One-time payment! No recurring fees! Life-long access to videos! Reduce fear, uncertainty and doubt while investing! Learn how to plan for your goals before and after retirement with confidence.
Increase your income by getting people to pay for your skills! ⇐ More than 800 salaried employees, entrepreneurs and financial advisors are part of our exclusive community! Learn how to get people to pay for your skills! Whether you are a professional or small business owner seeking more clients through online visibility, or a salaried individual looking for a side income or passive income, we will show you how to achieve this by showcasing your skills and building a community that trusts and pays you. (watch 1st lecture for free). One-time payment! No recurring fees! Life-long access to videos!
Our book for kids: “Chinchu Gets a Superpower!” is now available!


Must-read book even for adults! This is something that every parent should teach their kids right from their young age. The importance of money management and decision making based on their wants and needs. Very nicely written in simple terms. - Arun.Buy the book: Chinchu gets a superpower for your child!
How to profit from content writing: Our new ebook is for those interested in getting a side income via content writing. It is available at a 50% discount for Rs. 500 only!
Do you want to check if the market is overvalued or undervalued? Use our market valuation tool (it will work with any index!), or get the Tactical Buy/Sell timing tool!
We publish monthly mutual fund screeners and momentum, low-volatility stock screeners.
About freefincal & its content policy. Freefincal is a News Media organisation dedicated to providing original analysis, reports, reviews and insights on mutual funds, stocks, investing, retirement and personal finance developments. We do so without conflict of interest and bias. Follow us on Google News. Freefincal serves more than three million readers a year (5 million page views) with articles based only on factual information and detailed analysis by its authors. All statements made will be verified with credible and knowledgeable sources before publication. Freefincal does not publish paid articles, promotions, PR, satire or opinions without data. All opinions will be inferences backed by verifiable, reproducible evidence/data. Contact Information: To get in touch, please use our contact form. (Sponsored posts or paid collaborations will not be entertained.)
Connect with us on social media
- Twitter @freefincal
- Subscribe to our YouTube Videos
- Posts feed via Feedburner.
Our publications
You Can Be Rich Too with Goal-Based Investing
 Published by CNBC TV18, this book is designed to help you ask the right questions and find the correct answers. Additionally, it comes with nine online calculators, allowing you to create custom solutions tailored to your lifestyle. Get it now.
Gamechanger: Forget Startups, Join Corporate & Still Live the Rich Life You Want
 This book is designed for young earners to get their basics right from the start! It will also help you travel to exotic places at a low cost! Get it or gift it to a young earner.
Your Ultimate Guide to Travel
 This is an in-depth exploration of vacation planning, including finding affordable flights, budget accommodations, and practical travel tips. It also examines the benefits of travelling slowly, both financially and psychologically, with links to relevant web pages and guidance at every step. Get the PDF for Rs 300 (instant download)