Last Updated on April 14, 2026 at 11:48 am
We evaluate the SIP performance of DSP Midcap Fund with multiple benchmarks. The fund may not be popular on personal finance forums but it has the second-largest AUM in the midcap fund category with almost Rs. 6500 crores.
In our July 2019 review of the fund, we had said, “DSP Midcap has been one of the top three performers in the mid cap space in term of consistently beating the benchmark over 1,2,3,4 and 5 years with good downside protection“.
It had also featured in these two lists: Only these 3 midcap mutual funds have beat Nifty Next 50 consistently! and Only 6 Midcap Mutual Funds beat Nifty Midcap 150 in the last 5 years. So expectations are fairly high from this fund.
🔥Secure your future with our Robo-advisory tool trusted by over 3,500 investors and advisors. From effortless retirement planning to funding your children’s biggest dreams, turn your financial goals into reality. 🔥
Subscribe for money management solutions via email! (Link takes you to our email sign-up form) Join 32,000+ readers in our community.
👉 New Tool Alert! NaviPlan: A Privacy-Focused Multi-asset Tracker and Goal Planner 👈
Like most midcap and smallcap funds today, the fund also started out as DSP BlackRock Small and Mid Cap Fund (BlackRock has since exited) in Nov 2006 with a mandate to invest 65% of assets outside the top 100 companies by market capitalization (both mid and small cap stocks).
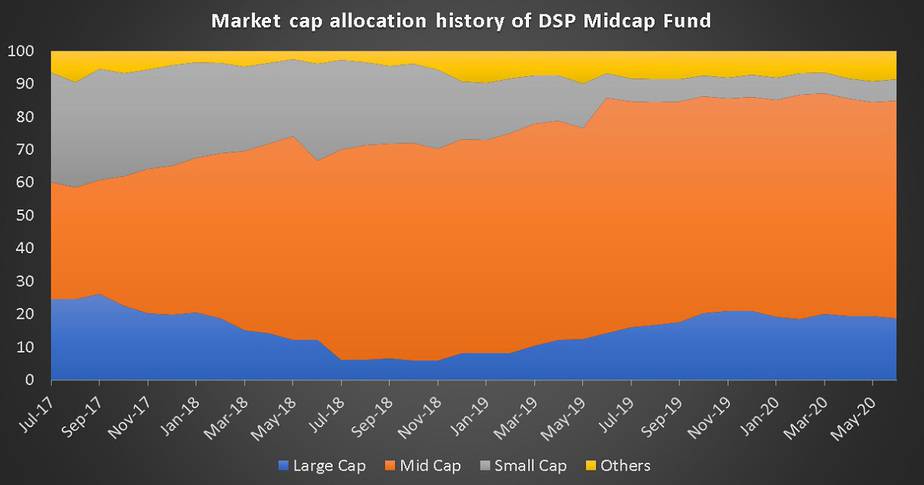
To comply with SEBI categorization rules, the fund became DSP Midcap in March 2018. This shift is evident from its market cap allocation history since July 2017. The fund has had a balanced multicap like market cap allocation before the change in mandate. This must be kept in mind while evaluating the SIP returns below.
Market cap allocation history of DSP Midcap Fund
SIP Performance of DSP Midcap Fund
We compare the 1-13 year SIP performance of the fund with:
- Nifty LargeMidcap 250 Index – TRI
- Nifty MidSmallcap 400 Index – TRI
- Nifty Midcap 150 – TRI
- Nifty Midcap 50 – TRI
- Nifty Midcap 100 – TRI
- NIFTY NEXT 50 – TRI
These benchmarks are reasonably representative of (1) the fund’s past mandate; (2) the fund’s present mandate and (3) what the fund ought to beat Nifty Midcap 1000 and NIfty Next 50.
| SIP Duration | DSP Midcap Fund(G)-Direct Plan | DSP Midcap Fund-Reg(G) | Nifty Midcap 150 – TRI | Nifty Midcap 50 – TRI | Nifty Midcap 100 – TRI |
| 1Y | 5.40 | 4.48 | 2.15 | 2.35 | -1.83 |
| 2Y | 4.14 | 3.20 | -2.32 | -4.05 | -6.27 |
| 3Y | 2.19 | 1.29 | -3.35 | -4.73 | -7.05 |
| 4Y | 4.01 | 3.08 | -0.07 | -1.39 | -3.97 |
| 5Y | 6.67 | 5.71 | 3.10 | 2.16 | -0.59 |
| 6Y | 8.05 | 7.10 | 4.79 | 3.46 | 1.42 |
| 7Y | 11.79 | 10.80 | 8.30 | 6.27 | 4.94 |
| 8Y | 12.38 | 9.92 | 7.58 | 6.62 | |
| 9Y | 13.16 | 10.90 | 8.15 | 7.67 | |
| 10Y | 12.96 | 10.73 | 7.73 | 7.69 | |
| 11Y | 13.28 | 10.84 | 7.49 | 8.02 | |
| 12Y | 14.83 | 12.15 | 8.32 | 9.42 | |
| 13Y | 14.35 | 11.58 | 7.76 | 9.15 |
| SIP Duration | DSP Midcap Fund(G)-Direct Plan | DSP Midcap Fund-Reg(G) | NIFTY NEXT 50 – TRI | Nifty LargeMidcap 250 Index – TRI | Nifty MidSmallcap 400 Index – TRI |
| 1Y | 5.40 | 4.48 | 1.80 | 0.98 | 0.01 |
| 2Y | 4.14 | 3.20 | -1.05 | -1.37 | -4.95 |
| 3Y | 2.19 | 1.29 | -2.02 | -1.17 | -6.38 |
| 4Y | 4.01 | 3.08 | 0.91 | 1.89 | -3.04 |
| 5Y | 6.67 | 5.71 | 3.90 | 4.49 | 0.34 |
| 6Y | 8.05 | 7.10 | 5.41 | 5.51 | 2.22 |
| 7Y | 11.79 | 10.80 | 8.15 | 7.95 | 6.07 |
| 8Y | 12.38 | 9.69 | 9.24 | 7.89 | |
| 9Y | 13.16 | 10.77 | 10.09 | 8.97 | |
| 10Y | 12.96 | 10.65 | 9.95 | 8.90 | |
| 11Y | 13.28 | 10.80 | 10.01 | 9.10 | |
| 12Y | 14.83 | 12.37 | 11.05 | 10.44 | |
| 13Y | 14.35 | 11.90 | 10.58 | 9.95 |
That is indeed an excellent track record. While that is no guarantee of future outperformance, it is a good enough reason to invest in the fund.