Last Updated on December 29, 2015 at 7:55 pm
A discussion on how the term spread, which is the difference between the 10-year & 3-month government bond yield, can be considered as a macroeconomic indicator
A macroeconomic indicator is one which gives an indication about the current state and future trend in the economy. Macroeconomic indicators can be used to change the asset allocation in a portfolio to safeguard losses or increase returns.
Asset allocation refers to the percentage allocation to different assets in a portfolio (say 60% equity and 40 % fixed income or debt). Tactical asset allocation refers to the change in allocation depending on developments in a specific market or economy as a whole.
Whether one should adopt such a strategy or stick to fixed asset allocation (plus periodic rebalancing)* depends on the risk appetite of the individual and/or the risk profile of the goal.
🔥Secure your future with our Robo-advisory tool trusted by over 3,000 investors and advisors. From effortless retirement planning to funding your children’s biggest dreams, turn your financial goals into reality. 🔥
Subscribe for money management solutions via email! (Link takes you to our email sign-up form) Join 32,000+ readers in our community.
👉 New Tool Alert! NaviPlan: A Privacy-Focused Multi-asset Tracker and Goal Planner 👈
(*) Known as strategic asset allocation.
Any asset allocation must have a de-risking strategy in place – decrease allocation to volatile assets as withdrawal nears. This can be a gradual taper wrt the deadline or opportunity based. As far as I am concerned, using macroeconomic indicators for asset allocation is an opportunistic de-risking strategy as my corpus nears its goal. For example, a couple of bumper years in the stock market a few years from the goal may be enough to abandon the asset allocation strategy and shift to the safety of fixed income.
I would like to discuss different macroeconomic indicators in a series of posts and would like to start with the term spread. The following is provided for academic purposes only and should not be construed as investment advice.
Term spread = 10-year GOI bond yield – 3 month GOI bond yield.
Bond yield is IRR of the bond investment, taking into account all the interest payments along with the investment and receipt of the investment upon maturity. This definition is valid whether the bond is purchased in the primary market when it was issued or in the secondary market when its value is marked to market.
When rates fall, new bonds have lower coupon rates (interest rates), resulting in lower IRR and lower yields. To ensure existing bonds can be sold, their yields must be matched (lowered in this case) to the new bonds. This is done by increasing the price of existing bonds. Thus, higher the price of an existing bond, lower its yield.
The difference between the long-term and short-term bond yields can be thought of as an indicator of the state of the economy and therefore of the equity markets. This idea can be graphically represented by the so-called yield curve, where the current yields of short and long-term bonds are plotted. Read more about yield curve here: The Rate Cut in Perspective.
The term spread and the yield curve are equivalent concepts. The yield curves gives you an idea about the current state of the economy, while the term spread can be used to study historical trends.
When the term spread is positive, long-term bond yields are higher than short-term yield. This means long-term borrowing is rewarded more than short-term borrowing. Yield is inversely proportional to price. So this means the price of the long-term bond is cheaper than the short-term bond. Thus, there is a supply (and demand) for long-term bonds. Meaning the economy is doing well and investors happy to borrow for the long-term.
When the term spread is small or close to zero, then there is uncertainty about the economy. When the spread is negative then investors do not want to borrow for the long-term.
The term spread is also indicative of future interest rates and inflation. Interest changes directly affect short-term bonds. When rates increase, the value of existing short-term bonds will fall and their yields will increase. The value of existing bonds have to fall becomes new short-term bonds are available at a higher interest rate.
Read more: Interest rate risk — When Interest rates Go up, Prices of Fixed-rate Bonds Fall
If the term spread is positive and large, it means it is bound to decrease (one cannot say when). That is, short-term yields are currently low and are about to increase.
For this to happen, the price of short-term bonds has to decrease. Meaning, rates of new bonds have to be higher. Meaning the RBI will have to increase rates (due to increasing inflation). The monetary review policy is slated for today. Inflation has recently increased, but the hope is the RBI will maintain status quo.
If the term spread become negative or at least small positive or near-zero, it means it is bound to increase. That is short-term yields are high and are about to decrease.
Meaning the value of short-term bonds have to increase, which will happen when the RBI decrease rates (due to falling inflation). This is possible assuming that the rates are positive and can be decreased (one cannot go beyond zero!).
This is how the rate cycle works. Let us now look at past data and see if some sense can be made out it.
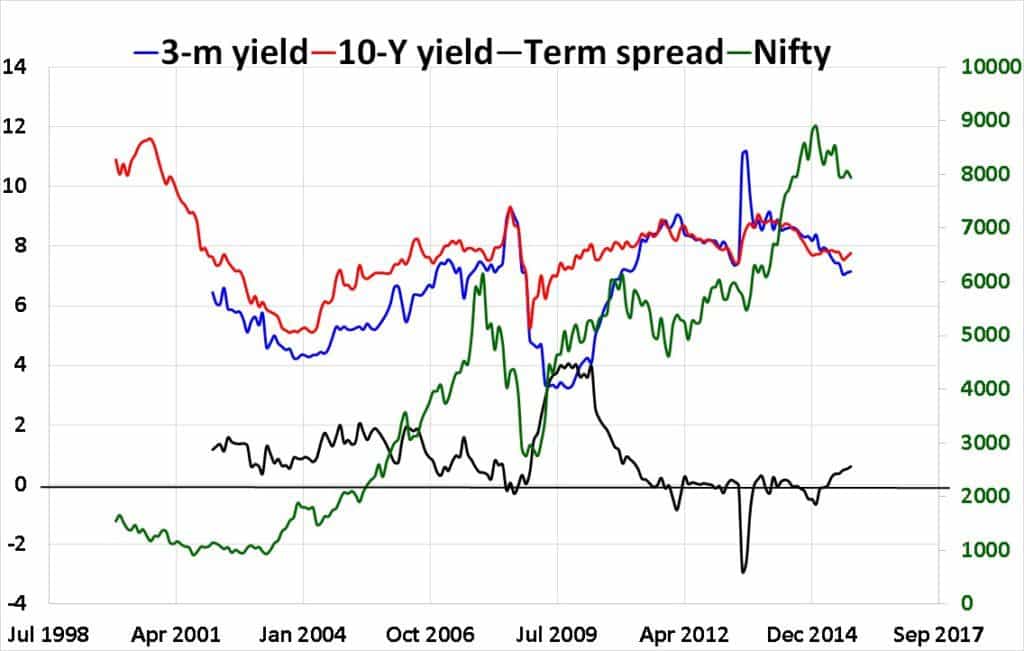
The term spread is the black line. Let us focus on only that and the green line (right axis) – the Nifty. It is not easy to make one-to-one correspondence, but the following observations can be made.
- During the bull run from 2002, the terms spread was a healthy positive.
- As the markets crashed in 2008, the term spread dropped close to zero.
- Its revival (due to sharp drop in interest rate) was short lived and it started falling from April 2010 signalling the start of a bear market.
- The sharp downside spike in July 2013 was due to RBI effort to contain the fall of the Rupee.
- Notice that the increase in Nifty in early 2014 was not correlated to the term spread. It still hovered about zero. An indication that the rally was euphoria driven.
- It is only in the last 6 months or so the term spread has inhed above zero, thanks to 3 rate cuts this year.
- The future is uncertain
Can the term spread be used for asset allocation?
“The term spread is an indicator for economic activity” –Macro-Based Parametric Asset Allocation (pdf file of a research paper)
Perhaps a clear drop in term spread after being a healthy positive for aprolonged period can be used a trigger for decreasing equity. Similarly, an increasing term spread can be trigger for increasing equity. As always such things are easier said than done and is so much easier to make such statements with the benefit of hindsight.
‘Prolonged period’, and ‘clear drop’, those are the key factors. It is not always easy to identify trends. If there are rapid up and down swings, the metric is not of much use.
Like any metric, the term spread cannot obviously be used on it own to make investment decisions. However, it does give you a reasonable indication of the state of the economy.

Join 32,000+ readers and get free money management solutions delivered to your inbox! Subscribe to get posts via email! (Link takes you to our email sign-up form)
🔥You can also avail massive discounts on our courses and the freefincal investor circle! 🔥& join our community of 8000+ users!
Track your mutual funds and stock investments with this Google Sheet!
We also publish monthly equity mutual funds, debt and hybrid mutual funds, index funds, and ETF screeners, as well as momentum and low-volatility stock screeners.
You can follow our articles on Google News

We have over 1,000 videos on YouTube!

Join our WhatsApp Channel


- Do you have a comment about the above article? Reach out to us on Twitter: @freefincal or @pattufreefincal
- Have a question? Subscribe to our newsletter using the form below.
- Hit 'reply' to any email from us! We do not offer personalised investment advice. We can write a detailed article without mentioning your name if you have a generic question.
Join 32,000+ readers and get free money management solutions delivered to your inbox! Subscribe to get posts via email! (Link takes you to our email sign-up form)
About The Author
Dr M. Pattabiraman (PhD) is the founder, managing editor and primary author of freefincal. He is an associate professor at the Indian Institute of Technology, Madras. He has over 14 years of experience publishing news analysis, research and financial product development. Connect with him via Twitter(X), LinkedIn, or YouTube. Pattabiraman has co-authored three print books: (1) You can be rich too with goal-based investing (CNBC TV18) for DIY investors. (2) Gamechanger for young earners. (3) Chinchu Gets a Superpower! for kids. He has also written seven other free e-books on various money management topics. He is a patron and co-founder of “Fee-only India,” an organisation promoting unbiased, commission-free, AUM-independent investment advice.
Our flagship course! Learn to manage your portfolio like a pro to achieve your goals regardless of market conditions! ⇐ More than 3,500 investors and advisors are part of our exclusive community! Get clarity on how to plan for your goals and achieve the necessary corpus no matter the market condition!! Watch the first lecture for free! One-time payment! No recurring fees! Life-long access to videos! Reduce fear, uncertainty and doubt while investing! Learn how to plan for your goals before and after retirement with confidence.
Increase your income by getting people to pay for your skills! ⇐ More than 800 salaried employees, entrepreneurs and financial advisors are part of our exclusive community! Learn how to get people to pay for your skills! Whether you are a professional or small business owner seeking more clients through online visibility, or a salaried individual looking for a side income or passive income, we will show you how to achieve this by showcasing your skills and building a community that trusts and pays you. (watch 1st lecture for free). One-time payment! No recurring fees! Life-long access to videos!
Our book for kids: “Chinchu Gets a Superpower!” is now available!


Must-read book even for adults! This is something that every parent should teach their kids right from their young age. The importance of money management and decision making based on their wants and needs. Very nicely written in simple terms. - Arun.Buy the book: Chinchu gets a superpower for your child!
How to profit from content writing: Our new ebook is for those interested in getting a side income via content writing. It is available at a 50% discount for Rs. 500 only!
Do you want to check if the market is overvalued or undervalued? Use our market valuation tool (it will work with any index!), or get the Tactical Buy/Sell timing tool!
We publish monthly mutual fund screeners and momentum, low-volatility stock screeners.
About freefincal & its content policy. Freefincal is a News Media organisation dedicated to providing original analysis, reports, reviews and insights on mutual funds, stocks, investing, retirement and personal finance developments. We do so without conflict of interest and bias. Follow us on Google News. Freefincal serves more than three million readers a year (5 million page views) with articles based only on factual information and detailed analysis by its authors. All statements made will be verified with credible and knowledgeable sources before publication. Freefincal does not publish paid articles, promotions, PR, satire or opinions without data. All opinions will be inferences backed by verifiable, reproducible evidence/data. Contact Information: To get in touch, please use our contact form. (Sponsored posts or paid collaborations will not be entertained.)
Connect with us on social media
- Twitter @freefincal
- Subscribe to our YouTube Videos
- Posts feed via Feedburner.
Our publications
You Can Be Rich Too with Goal-Based Investing
 Published by CNBC TV18, this book is designed to help you ask the right questions and find the correct answers. Additionally, it comes with nine online calculators, allowing you to create custom solutions tailored to your lifestyle. Get it now.
Gamechanger: Forget Startups, Join Corporate & Still Live the Rich Life You Want
 This book is designed for young earners to get their basics right from the start! It will also help you travel to exotic places at a low cost! Get it or gift it to a young earner.
Your Ultimate Guide to Travel
 This is an in-depth exploration of vacation planning, including finding affordable flights, budget accommodations, and practical travel tips. It also examines the benefits of travelling slowly, both financially and psychologically, with links to relevant web pages and guidance at every step. Get the PDF for Rs 300 (instant download)